AlertX
It incorporates the functionality of Prometheus, Alert Manager, the alerting capabilities based on rules and our in-house developed exporters. The add-on functionality of NHC, Node Health Checking allows for automatic node draining from the queuing system to prevent (further) job failures or even a 'black hole' effect where failed nodes will chew through the queued jobs, failing each one of them, leaving an empty queue.
Philosphy
Though various projects exist to automatically drain or exclude nodes from participating in new jobs, the biggest drawback of this approach are non-matching rules defined in an alerting or monitoring system. This results in having nodes drained without knowing these were in a bad state or alerted nodes not being drained. In addition to this, a job that's being rescheduled will be placed back in the queue where it might not be the first in line anymore. To combine the power of collecting metrics and base rules on these, allowing for alerting and if desired also drain nodes, only one set of rules need to be defined; a single source of truth. Since the metrics are being collected continuesly, it immediately becomes clear when a node turned problematic instead of a trial/error approach with regular NHC systems.
Generic rules, Services and Hardware
AlertX has three rule domains: Generic rules where operating system rules are typically defined, Services rules to observe required services like sshd or sssd and Hardware rules, which are automatically generated upon first boot.
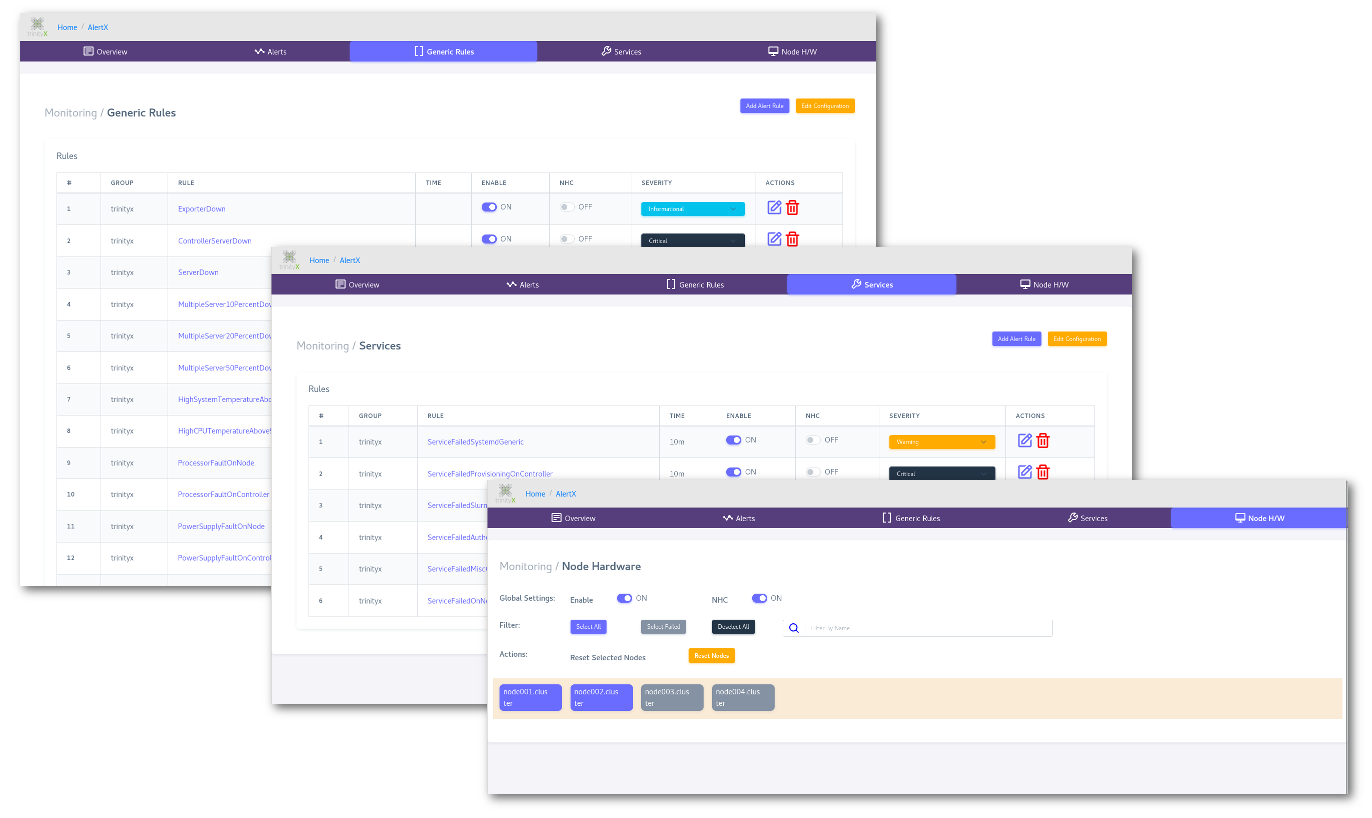
Generic and Services rules are individually configurable where Hardware rules are typically based on the hardware configuration of nodes. The latter allows for a reset to match the current state again after a hardware change.
Rules versus NHC
NHC functionality can be enabled in addition to a rule. This means that for a specific NHC functionality, a rule has to be specified first. NHC is a subset of Rules.
NHC enabled and triggered alerts result in draining the affected nodes.
TrinityX 15.2+
'controller' rules with NHC enabled, will drain all nodes in the cluster. The idea behind this is to have events seen on the controller, but affecting the actual nodes, actually drain the nodes. An example would be an controller exported filesystem like home where insufficient space would render problems for the nodes. A controller rule can be recognized by the 'job=luna_controllers' part in a rule.Overview and Alerts
The overview pane shows the status of the controllers and nodes.
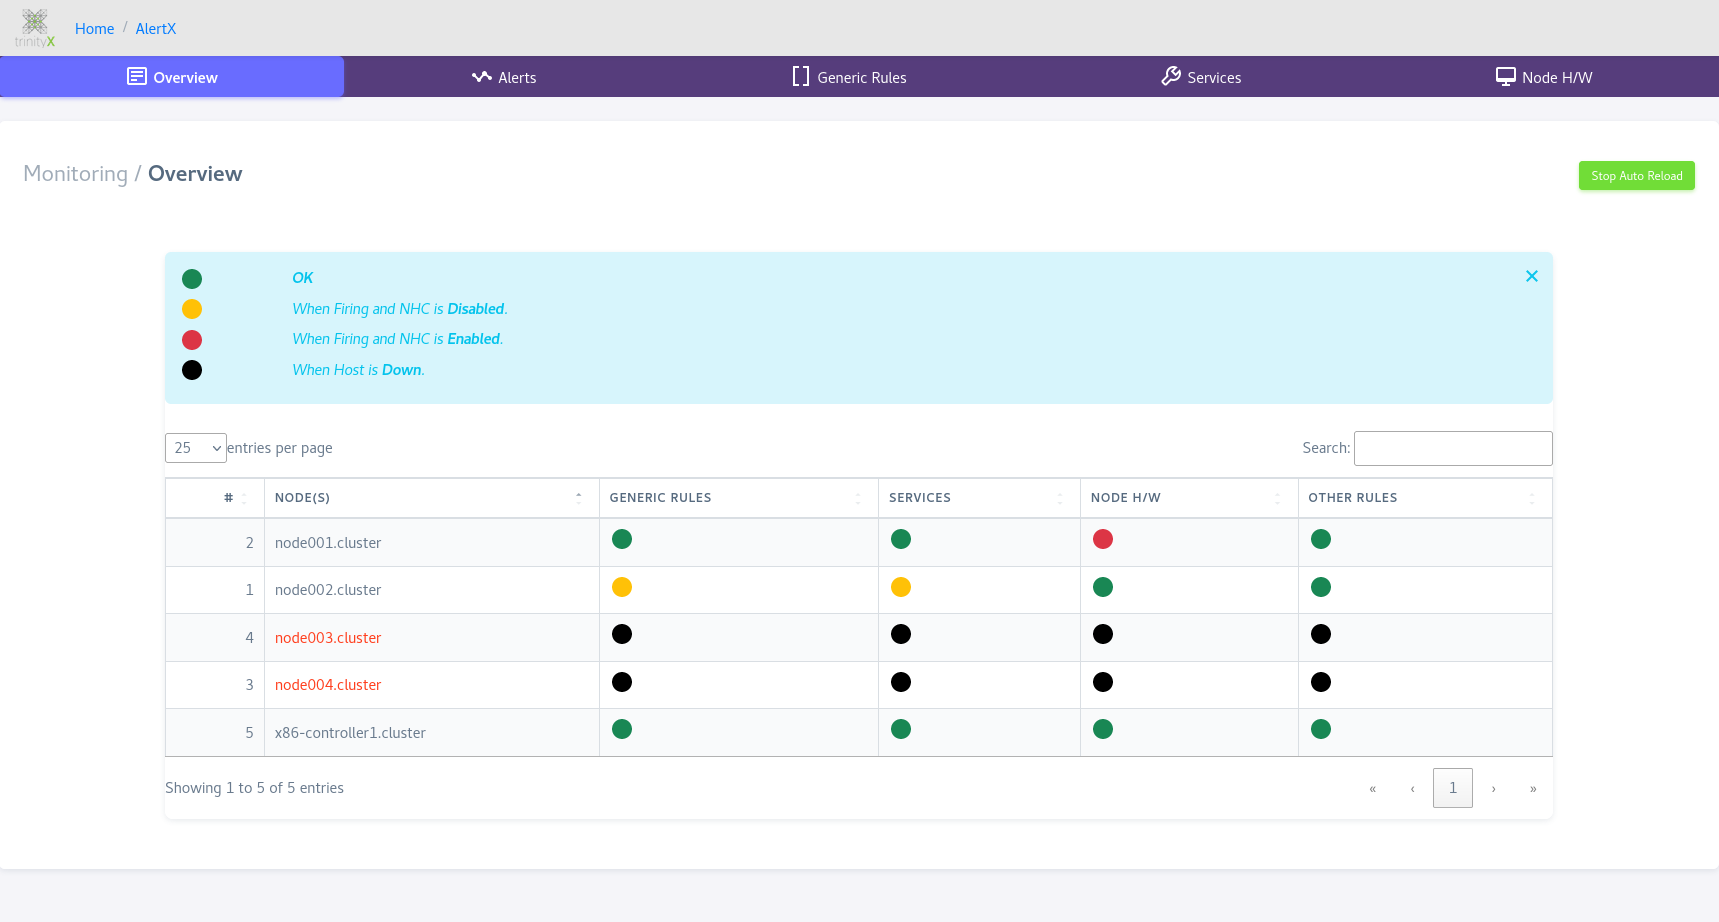
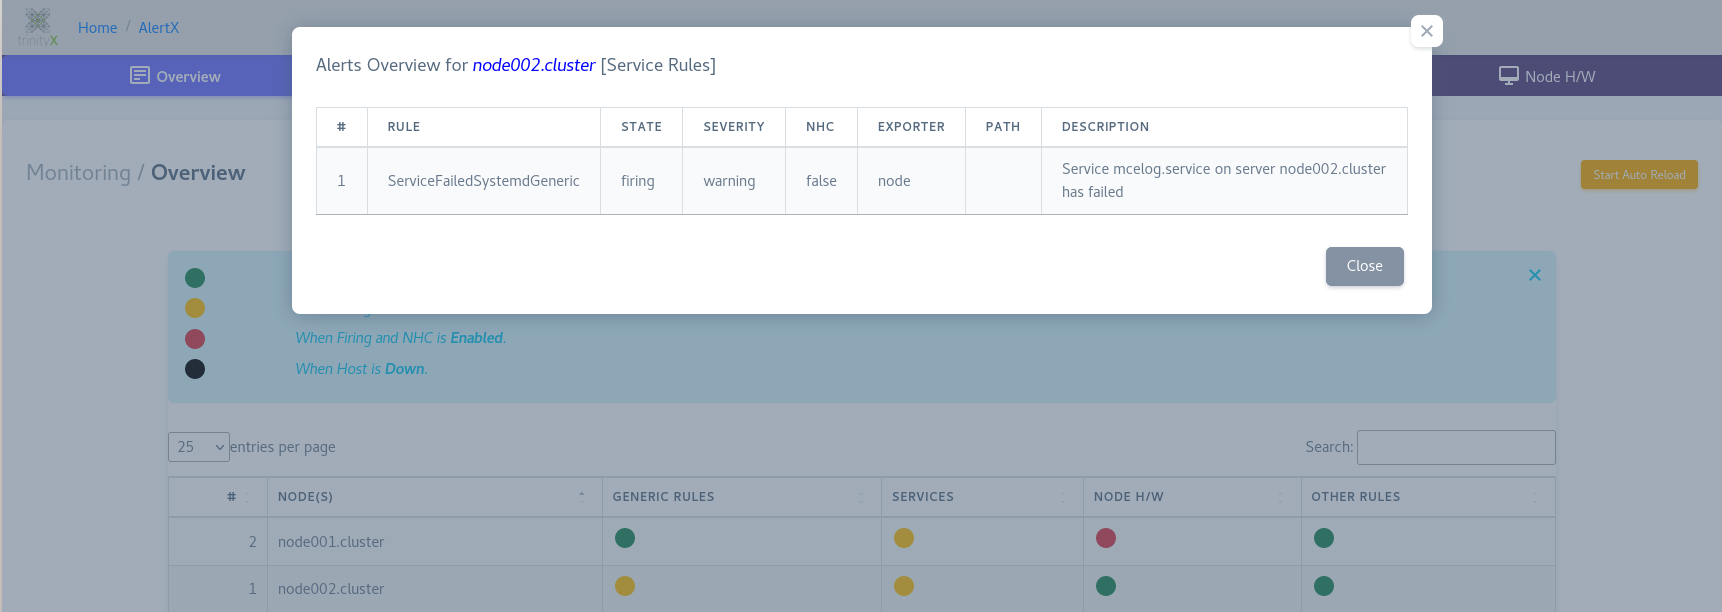
Details regarding the state can be observed by a simple click:
The Alerts pane shows a more detailed description of triggered alerts.
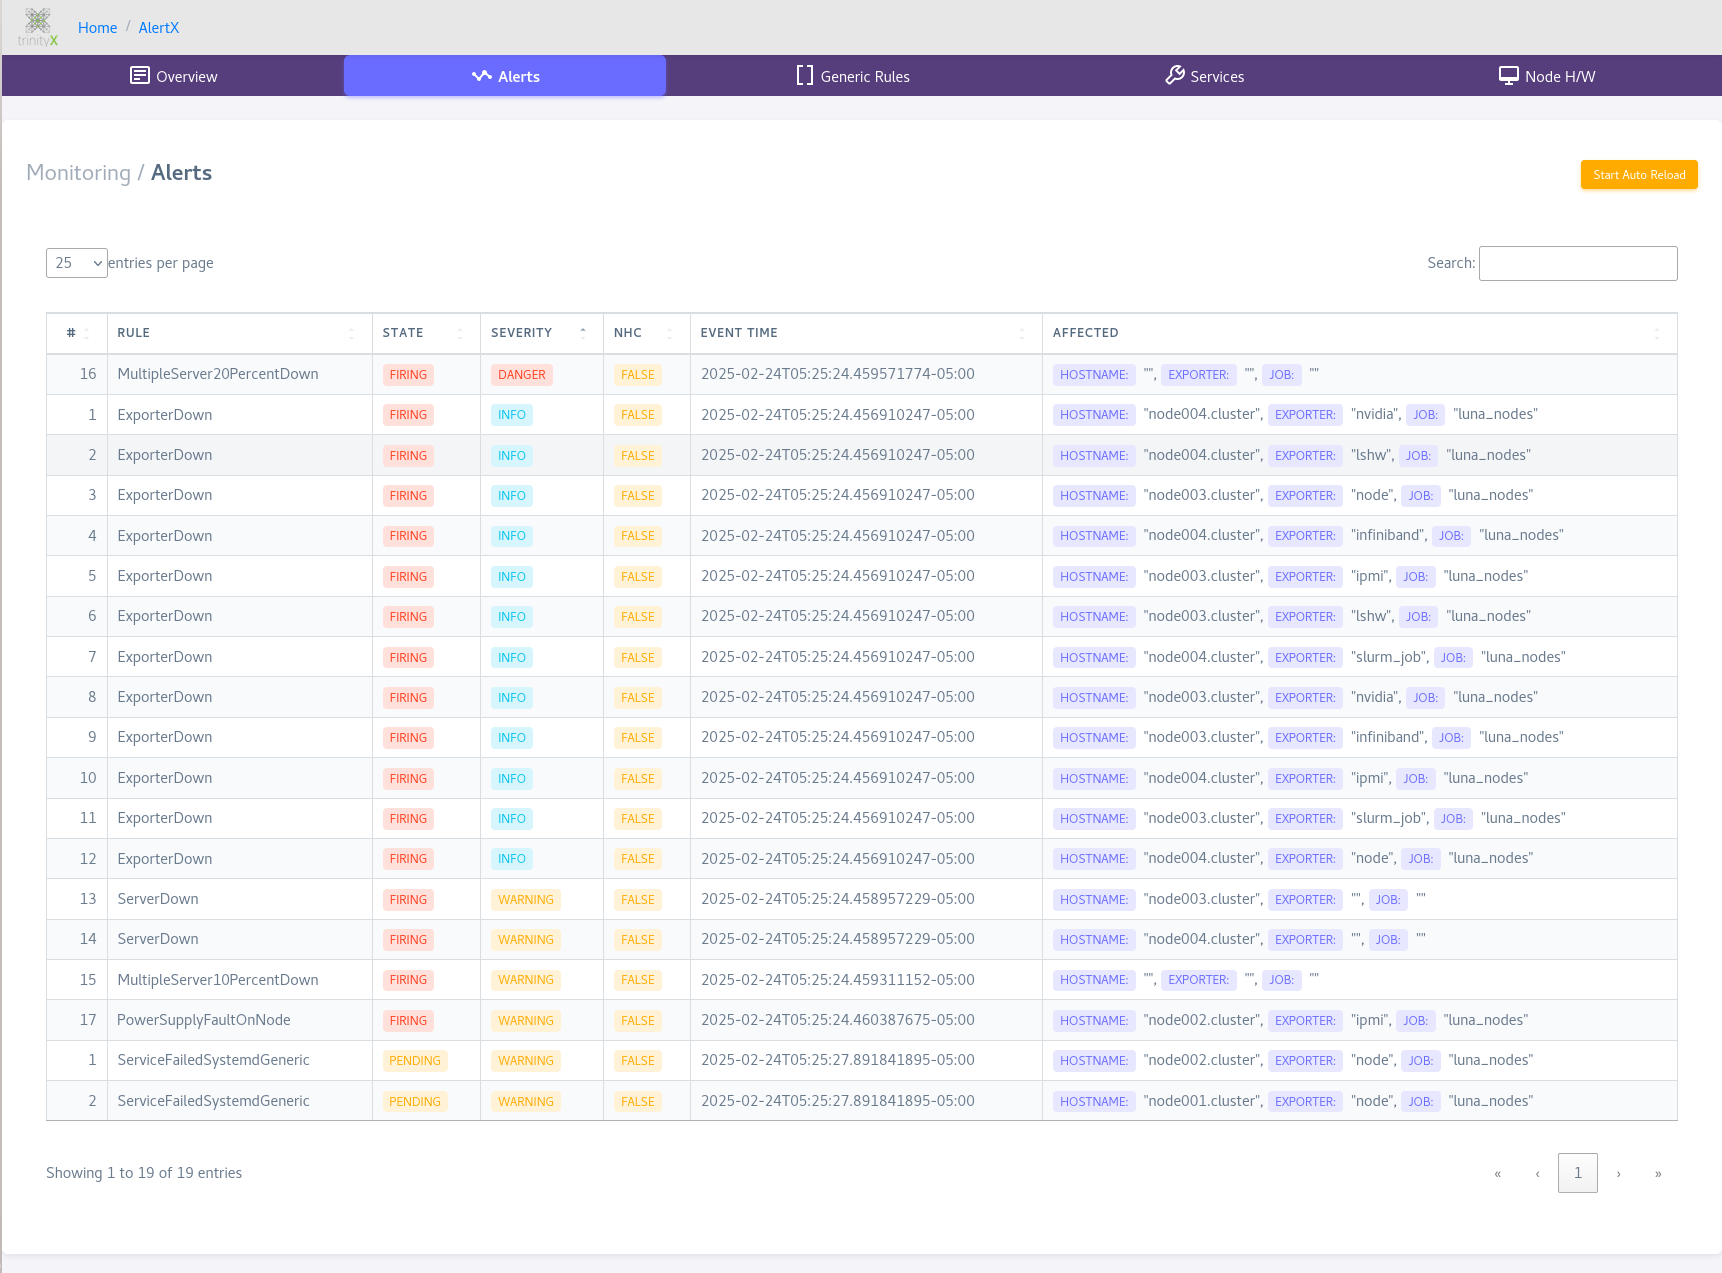
Details regarding the alert can be viewed as well:

Rule Creation Wizard
TrinityX 15.2 comes with the AlertX Rule Creation Wizard, which lowers the threshold generating a prometheus rule for monitoring.
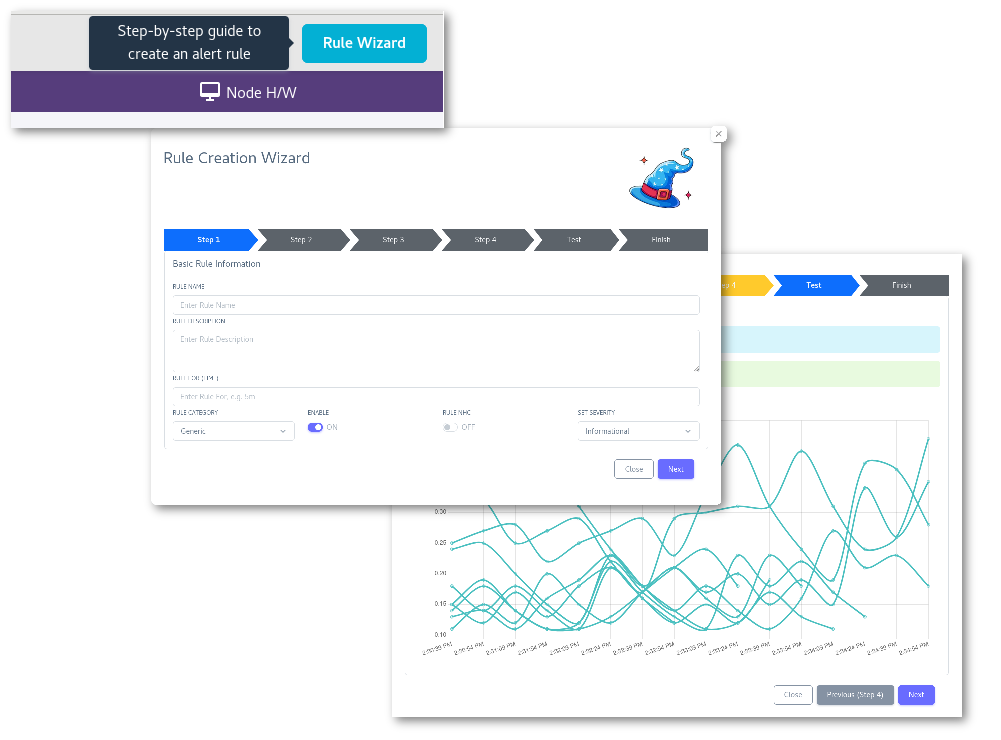
The wizard offers a step by step approach, allowing browsing and searching for metrics and a verification step before saving the new rule. This rule can later be modified or changed to each' needs.
Draining nodes
The AlertX drainer, drains as the name implies, nodes when an NHC rule is triggered. An example when enquering more details:
000000 13:12:32 [root@controller1 ~]# scontrol show node node001
NodeName=node001 Arch=x86_64 CoresPerSocket=30
   CPUAlloc=1 CPUEfctv=60 CPUTot=60 CPULoad=0.43
   AvailableFeatures=(null)
   ActiveFeatures=(null)
   ...
   ...
   Reason=Trix-drainer: MissingHardwareComponent error triggered, check AlertX to debug [root@2025-02-24T13:12:48]
When the involved node(s) are cleared from their problems, these will be undrained or resumed for new jobs.
To (temporary) disable the draining, stop the alertx-drainer service: systemctl stop alertx-drainer.
Note that this should be seen as a temporary approach where it comes highly recommended to find the actual root cause of the problem.
To disable the automatic undraining, change the setting AUTO_UNDRAIN in /trinity/local/alertx/drainer/config/drainer.ini and restart
the alertx-drainer service. This prevents the undraining of an AlertX drained node after a problem has cleared.
Commandline interface
AlertX also provides a commandline interface or CLI in short. All the functionality of the Graphical interface can be accessed through the CLI as well.
The Graphical interface 'panes' using the CLI
The Graphical interface shows Overview, Alerts, Generic, Service and Hardware

The CLI uses the same approach.
The overview can be seen by invoking alertx overview:
# alertx overview
+---------------------------------------------------------------------------------------------+
|                                     << AlertX Overview >>                                   |
+----+-------------------------+---------------+---------------+----------------+-------------+
| ID | Hostname                | Generic Rules | Service Rules | Hardware Rules | Other Rules |
+----+-------------------------+---------------+---------------+----------------+-------------+
| 1  | node001.cluster         | ● OK          | ● OK          | ● OK           | ● OK        |
| 5  | node002.cluster         | ● FAIL        | ● OK          | ● OK           | ● OK        |
| 3  | node003.cluster         | ● DOWN        | ● DOWN        | ● DOWN         | ● DOWN      |
| 4  | node004.cluster         | ● DOWN        | ● DOWN        | ● DOWN         | ● DOWN      |
| 2  | x86-controller1.cluster | ● OK          | ● OK          | ● OK           | ● OK        |
+----+-------------------------+---------------+---------------+----------------+-------------+
There is color support to aid in visibility:

...and when the affecting rule has been set as an NHC event:

Alerts can be seen through alertx alerts:
# alertx alerts
+--------------------------------------------------------------------------------------------------------------------------------------+
|                                                          << AlertX Alerts >>                                                         |
+----+-----------------------------+--------+----------+-----+-------------------------------+-----------------+----------+------------+
| ID | Rule                        | State  | Severity | NHC | Event Time                    | Hostname        | Exporter | Job        |
+----+-----------------------------+--------+----------+-----+-------------------------------+-----------------+----------+------------+
| 4  | MultipleServer20PercentDown | firing | danger   | no  | 2025-03-04 08:42:09 UTC+05:00 | None            | None     | None       |
| 1  | ServerDown                  | firing | warning  | no  | 2025-03-04 08:42:09 UTC+05:00 | node004.cluster | None     | None       |
| 2  | ServerDown                  | firing | warning  | no  | 2025-03-04 08:42:09 UTC+05:00 | node003.cluster | None     | None       |
| 3  | MultipleServer10PercentDown | firing | warning  | no  | 2025-03-04 08:42:09 UTC+05:00 | None            | None     | None       |
| 5  | PowerSupplyFaultOnNode      | firing | info     | yes | 2025-03-04 08:42:09 UTC+05:00 | node002.cluster | ipmi     | luna_nodes |
+----+-----------------------------+--------+----------+-----+-------------------------------+-----------------+----------+------------+
Generic rules can be seen using alertx generic:
# alertx generic
+---------------------------------------------------------------------------------------------+
|                                  << AlertX Generic Rules >>                                 |
+----+----------+------------------------------------------+------+--------+-------+----------+
| ID | Group    | Rule                                     | Time | Enable | NHC   | Priority |
+----+----------+------------------------------------------+------+--------+-------+----------+
| 1  | trinityx | ControllerServerDown                     | None | True   | False | info     |
| 2  | trinityx | ServerDown                               | None | True   | False | warning  |
| 3  | trinityx | MultipleServer10PercentDown              | None | True   | False | warning  |
| 4  | trinityx | MultipleServer20PercentDown              | None | True   | False | danger   |
| 5  | trinityx | MultipleServer50PercentDown              | None | True   | False | critical |
| 6  | trinityx | HighSystemTemperatureAbove70c            | 15m  | True   | False | danger   |
| 7  | trinityx | HighCPUTemperatureAbove90c               | 15m  | True   | False | danger   |
| 8  | trinityx | ProcessorFaultOnNode                     | None | True   | True  | warning  |
| 9  | trinityx | ProcessorFaultOnController               | None | True   | False | critical |
| 10 | trinityx | PowerSupplyFaultOnNode                   | None | True   | True  | warning  |
| 11 | trinityx | PowerSupplyFaultOnController             | None | True   | False | critical |
| 12 | trinityx | LocalFilesystemFull90PercentOnController | None | True   | False | warning  |
| 13 | trinityx | LocalFilesystemFull95PercentOnController | None | True   | False | danger   |
| 14 | trinityx | LocalFilesystemFull97PercentOnController | None | True   | False | critical |
| 15 | trinityx | HighCpuLoad50PercentOnController         | 1h   | True   | False | warning  |
| 16 | trinityx | HighCpuLoad90PercentOnController         | 1h   | True   | False | danger   |
| 17 | trinityx | HighCpuLoad100PercentOnController        | 1h   | True   | False | critical |
| 18 | trinityx | HighMemoryUsage75PercentOnController     | 1h   | True   | False | warning  |
| 19 | trinityx | HighMemoryUsage95PercentOnController     | 1h   | True   | False | danger   |
| 20 | trinityx | SwappingOnController                     | 15m  | True   | False | critical |
| 21 | trinityx | SwappingOnNodes                          | 15m  | True   | False | danger   |
| 22 | trinityx | ClockSkewDetected                        | None | True   | False | warning  |
| 23 | trinityx | ExcessiveTCPConnections                  | None | True   | False | warning  |
+----+----------+------------------------------------------+------+--------+-------+----------+
Service rules alertx service:
# alertx service
+--------------------------------------------------------------------------------------------+
|                                 << AlertX Service Rules >>                                 |
+----+----------+-----------------------------------------+------+--------+-------+----------+
| ID | Group    | Rule                                    | Time | Enable | NHC   | Priority |
+----+----------+-----------------------------------------+------+--------+-------+----------+
| 1  | trinityx | ServiceFailedSystemdGeneric             | 10m  | True   | False | warning  |
| 2  | trinityx | ServiceFailedProvisioningOnController   | 10m  | True   | False | critical |
| 3  | trinityx | ServiceFailedSlurmOnController          | 10m  | True   | False | critical |
| 4  | trinityx | ServiceFailedAuthenticationOnController | 10m  | True   | False | critical |
| 5  | trinityx | ServiceFailedMiscOnController           | 10m  | True   | False | critical |
| 6  | trinityx | ServiceFailedOnNodes                    | 10m  | True   | True  | danger   |
+----+----------+-----------------------------------------+------+--------+-------+----------+
And the Hardware rules alertx hardware:
# alertx hardware
+----------------------------------------------------------------------------------------------------------------------------------------+
|                                                       << AlertX Node Hardware >>                                                       |
+----+-----------------+--------+--------------------------------------------------------------------------------------------------------+
| ID | Node            | Status | Message                                                                                                |
+----+-----------------+--------+--------------------------------------------------------------------------------------------------------+
| 1  | node001.cluster | True   | None                                                                                                   |
| 2  | node002.cluster | True   | None                                                                                                   |
| 3  | node003.cluster | False  | Error encountered while reading the Prometheus Rules for node003.cluster: [Errno 2]                    |
|    |                 |        | No such file or directory: '/trinity/local/etc/prometheus_server/rules/trix.hw.node003.cluster.rules'. |
| 4  | node004.cluster | False  | Error encountered while reading the Prometheus Rules for node004.cluster: [Errno 2]                    |
|    |                 |        | No such file or directory: '/trinity/local/etc/prometheus_server/rules/trix.hw.node004.cluster.rules'. |
+----+-----------------+--------+--------------------------------------------------------------------------------------------------------+
Viewing overview or alerts affected node(s) details
For both the overview and alerts, details can be seen through alertx overview -H <subset>, where subset can be a complete nodename or 'match':
# alertx overview -H node002
+---------------------------------------------------------------------------------------------------------------------------+
|                                          << Generic Rules for [node002.cluster] >>                                        |
+----+------------------------+--------+----------+------+----------+------------+------------------------------------------+
| ID | Rule                   | State  | Severity | NHC  | Exporter | Path       | Description                              |
+----+------------------------+--------+----------+------+----------+------------+------------------------------------------+
| 1  | PowerSupplyFaultOnNode | firing | info     | true | ipmi     | luna_nodes | Power Supply fault detected by BMC board |
+----+------------------------+--------+----------+------+----------+------------+------------------------------------------+

# alertx alerts -H node002
+------------------------------------------------------------------------------------------------------------------------------------+
|                                         << AlertX Alerts >> [Filter By: Hostname: node002]                                         |
+----+---------------------------+--------+----------+-----+-------------------------------+-----------------+----------+------------+
| ID | Rule                      | State  | Severity | NHC | Event Time                    | Hostname        | Exporter | Job        |
+----+---------------------------+--------+----------+-----+-------------------------------+-----------------+----------+------------+
| 5  | PowerSupplyFaultOnNode    | firing | info     | yes | 2025-03-04 09:54:24 UTC+05:00 | node002.cluster | ipmi     | luna_nodes |
+----+---------------------------+--------+----------+-----+-------------------------------+-----------------+----------+------------+
Viewing rule details
The CLI can also be used to see rule details. The ID is obtained through alertx generic, using the ID column.
To view a generic rule with ID 6 details:
# alertx generic show 6
+----------------------------------------------------------------------------------------------------+
|                                  << AlertX Generic Rule >> [ID: 6]                                 |
+-------------+--------------------------------------------------------------------------------------+
| Group       | trinityx                                                                             |
| Rule        | HighSystemTemperatureAbove70c                                                        |
| Description | System temperature detected by BMC board is above 70C (current value: {{ $value }}C) |
| Expr        | ipmi_temperature_celsius{name=~"[Ss]ystem.*[Tt]emp"} > 70                            |
| For         | 15m                                                                                  |
| Enable      | True                                                                                 |
| NHC         | False                                                                                |
| Priority    | danger                                                                               |
+-------------+--------------------------------------------------------------------------------------+
Changing, removing or adding a rule
The CLI also supports adding, removing and changing rules. Please note that the 'ID' refers to the ID presented in the table for each type of rule respectively. In the above Generic rule listing, a rule named 'ServerDown' can be seen. This rule is identified by ID 2. Changing and removing rules are done through their respective ID-s. A few examples are show below.
To switch on NHC for generic rule 'PowerSupplyFaultOnNode':
alertx generic change 10 --nhc true
To change the service rule trigger time for rule 'ServiceFailedOnNodes':
alertx service change 6 -f '5m'
To add a rule in generic:
alertx generic add -f 15m -x 'ipmi_sensor_state{type="Power Supply", job="luna_nodes"} > 0' -d 'Power Supply fault detected by BMC board' -a NewPowerSupplyFaultOnNode
To remove a generic rule:
alertx generic remove 24
Files
The default location for the rules are in /trinity/local/etc/prometheus_server/rules. Rules starting with 'trix.' are typically managed by AlertX and are only to be managed through the CLI or graphical interface.
Below shows rule files for generic, services and hardware rules for two nodes.
000000 13:27:38 [root@controller1 ~]# ls -l /trinity/local/etc/prometheus_server/rules/
total 44
drwxr-xr-x. 2 root root        4096 Feb 24 12:39 backup
-rw-r-----. 1 root prometheus  7752 Feb 24 05:35 trix.generic.rules
-rw-r--r--. 1 root root       11683 Feb 24 13:12 trix.hw.node001.cluster.rules
-rw-r--r--. 1 root root        9422 Feb 24 12:37 trix.hw.node002.cluster.rules
-rw-r-----. 1 root prometheus  1399 Feb 21 09:09 trix.recording.rules
-rw-r-----. 1 root prometheus  2147 Feb 24 05:35 trix.service.rules
For every change made through a configuration change or a hardware reset, a copy of the previous rules file is kept in backup.
Additional rules files can be added but fall outside the scope of AlertX. Alerts however will still be triggered. These alerts would show up as part of 'others' in AlertX.
Known limitations
-
USB devides recognized as SCSI disks are seen as a valid drives. This means that a temporary USB drive will be seen as part of the footprint of a node at time of initial set or resetting/clearing of the involved node. AlertX cannot distinguish between the USB drive and a permanent drive, as such, the only way to rectify this situation is by manualy resetting/clearing the affected nodes.
-
Infiniband adapters are known to cause a fair amount of trouble, rendering false positives. Although Release 15.2 contains methods to mitigate these problems, there are cases where Infiniband adapters/HCA-s trigger false positives, especially after firmware upgrades and reboots. The problem can be mitigated by resetting/clearing the affected nodes after which further reboots should not trigger false positives.