Monitoring
TrinityX monitoring is based on the well known Prometheus and Grafana stack. Prometheus architecture is pull-based, meaning that each system and service to be monitored will expose an HTTP endpoint, that will be periodally scraped by the Prometheus Server
From an architectural perspective we can identify 4 major pillars:
- Metrics exporting
- Metrics collection & storing
- Dashboards & Graphing
- Alerting

Metrics exporting
TrinityX bundles 5 different prometheus exporters, some of them will run on controller nodes, other on compute nodes and some on both
| Name | Controller | Node | Port |
|---|---|---|---|
| node-exporter | ✅ | ✅ | 14200 |
| ipmi-exporter | ✅ | ✅ | 14202 |
| nvidia-exporter | ❌ | ✅ | 14203 |
| slurm-exporter | ✅ | ❌ | 14204 |
| ha-exporter | ✅ | ❌ | 14205 |
| infiniband-exporter | ✅ | ✅ | 14206 |
| slurm-job-exporter | ❌ | ✅ | 14207 |
Infiniband-exporter
TrinityX 15.3+ will only run the Infiniband exporter on the controllers and login nodes.Metrics collection & storing
Metrics collection is performed by a standard prometheus server, on a standard installation it is running on all the controllers at port 9000 and the configuration file can be found at trinity/local/etc/prometheus_server/prometheus.yml.
Intervals and timeouts
global:
  scrape_interval: 15s
  scrape_timeout: 10s
  evaluation_interval: 15s
Rule files
rule_files:
  - /trinity/local/etc/prometheus_server/rules/*.rules
Scraping targets, there are 3 locations from where targets are loaded, either with HTTP discovery and File-based discovery
scrape_configs:
  # TrinityX reserved - Luna daemon exposing dynamic list of node exporters
  - job_name: luna_controllers
    file_sd_configs:
    - files:
      - /trinity/local/etc/prometheus_server/file_sd/trix/*.yml
  # TrinityX reserved - File based controller exporters
  - job_name: luna_nodes
    http_sd_configs:
    - url: https://localhost:7050/export/prometheus
  # General Purpose - Additional exporters
  - job_name: other_nodess
    scheme: https
    file_sd_configs:
    - files:
      - /trinity/local/etc/prometheus_server/file_sd/other/*.yml
And alerting
alerting:
  alertmanagers:
    - static_configs:
        - targets:
          - localhost:9093
      scheme: https
      basic_auth:
        username: admin
        password: XXXXXXXXXXXXXX
Dashboards & Graphing
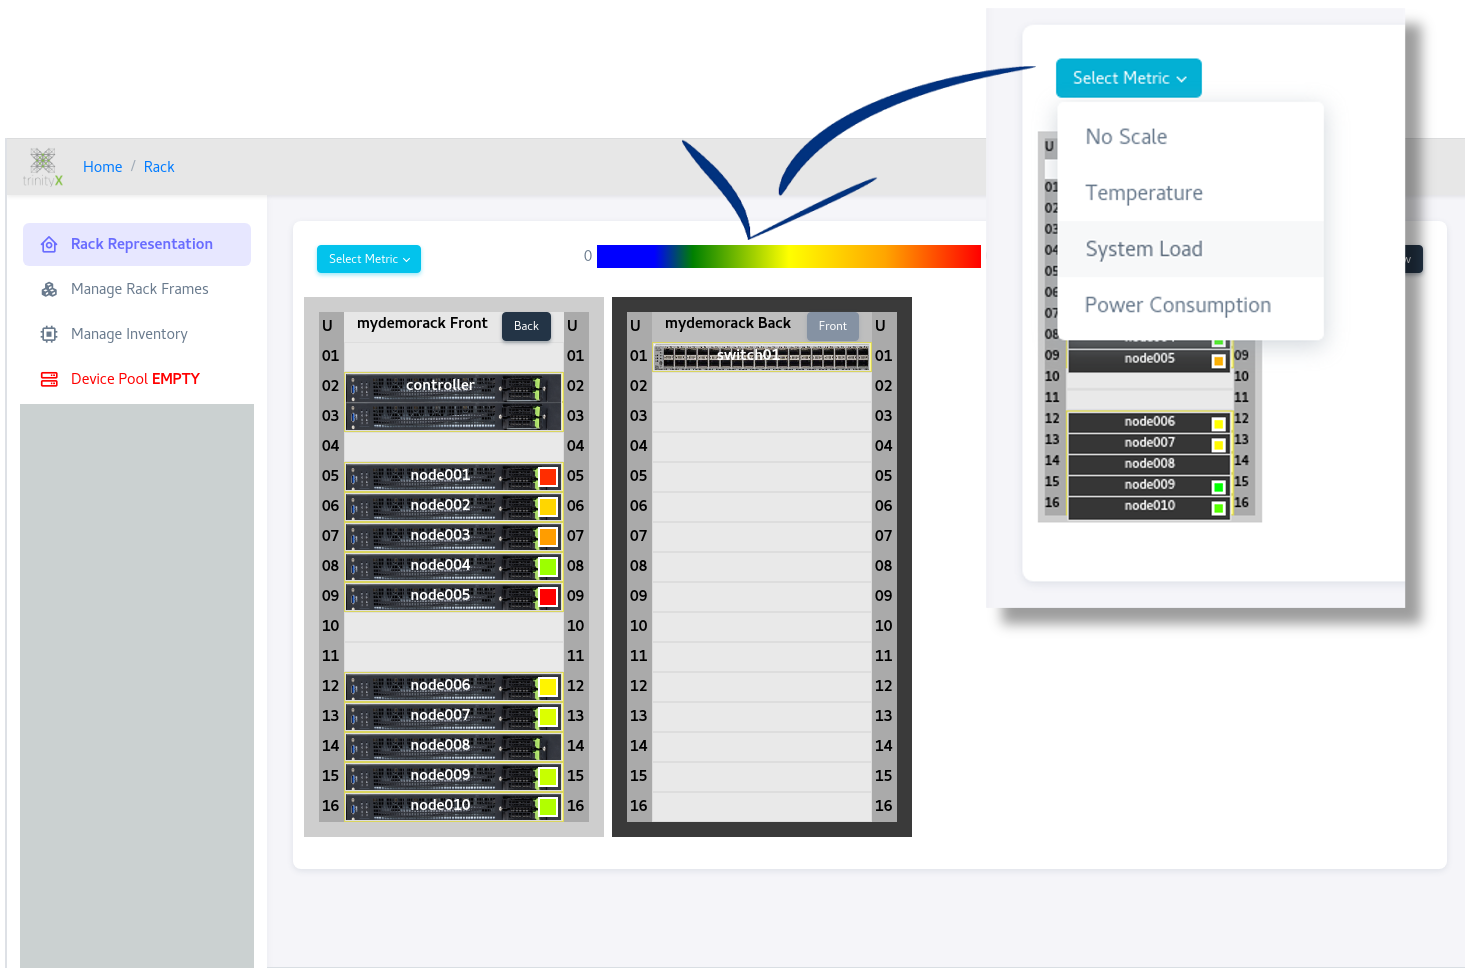
TrinityX come default with a rich set of graphical applications and grafana dashboards allowing to view the status of various components like rack view with metric overlay, cluster (home), slurm, zfs, HA and others.
Rackview is useful to locate temperature and power hot spots:
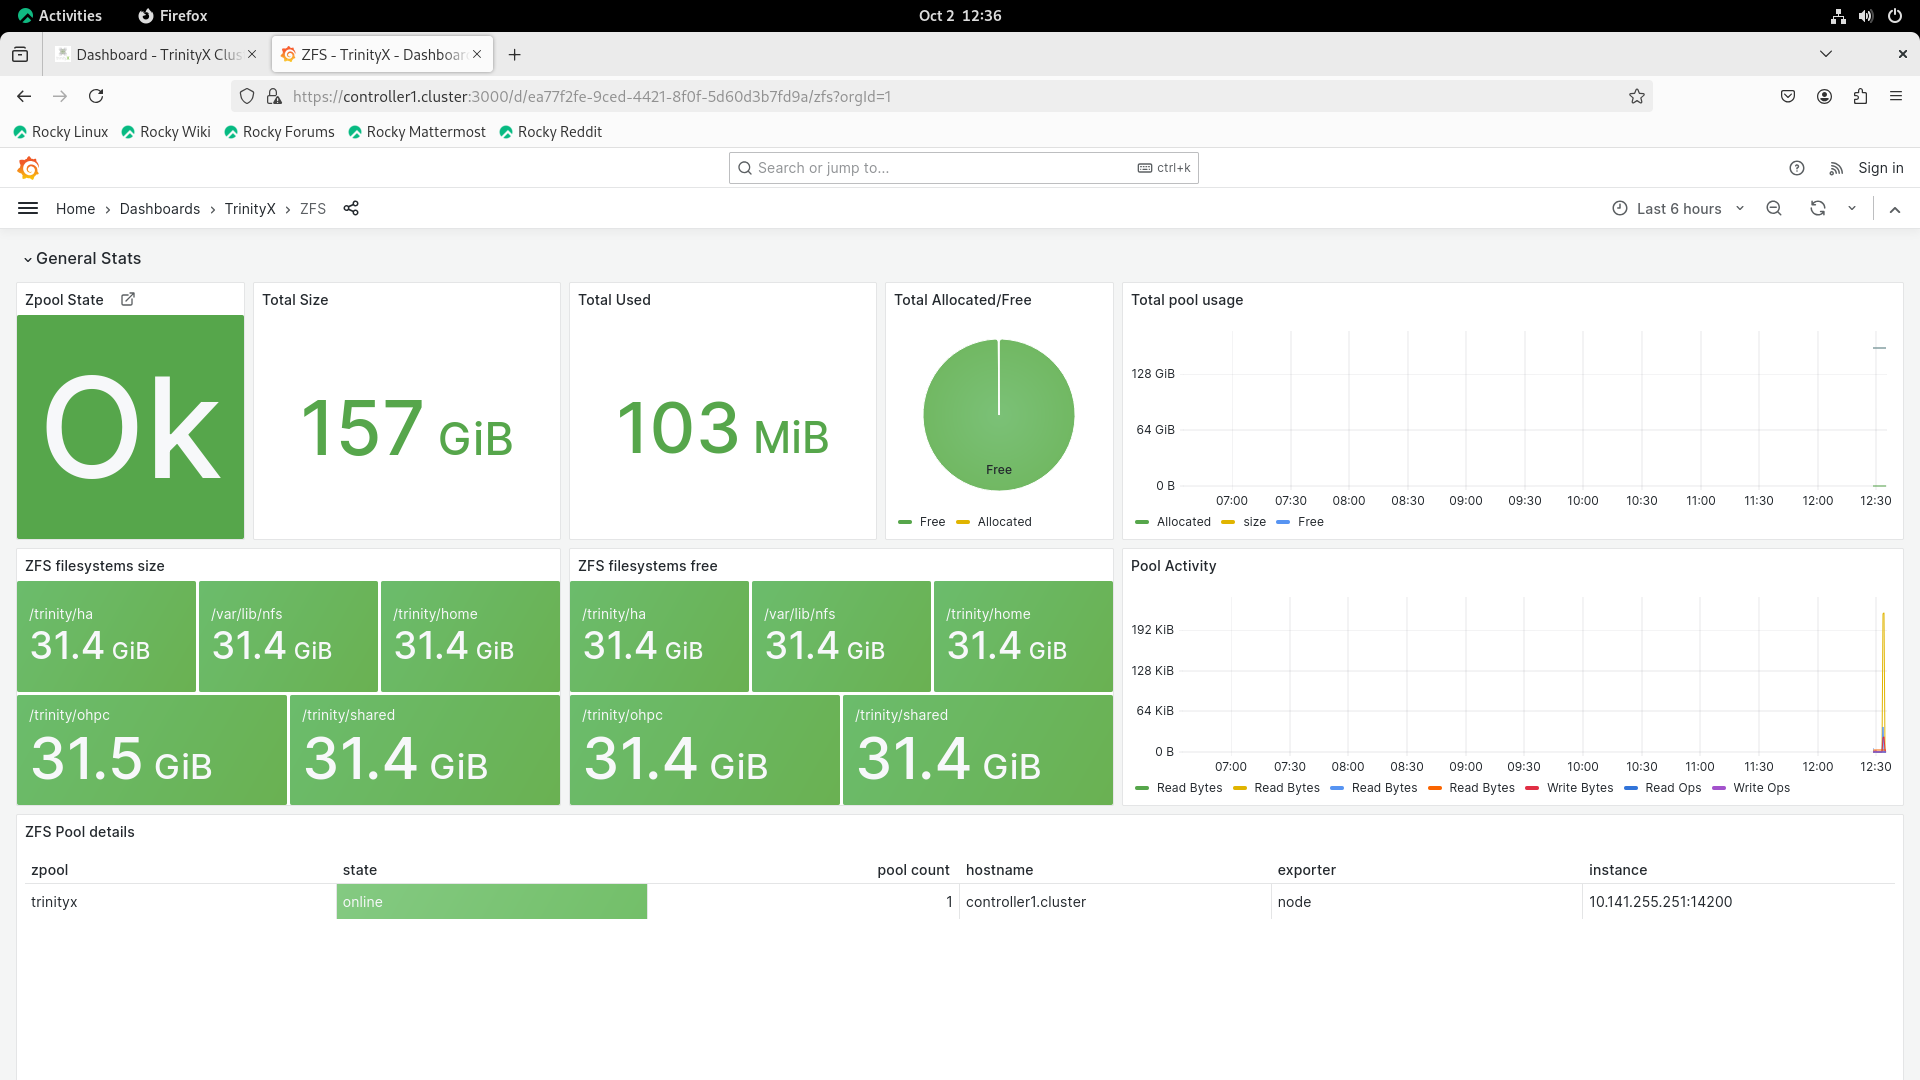
Some example grafana screenshots:
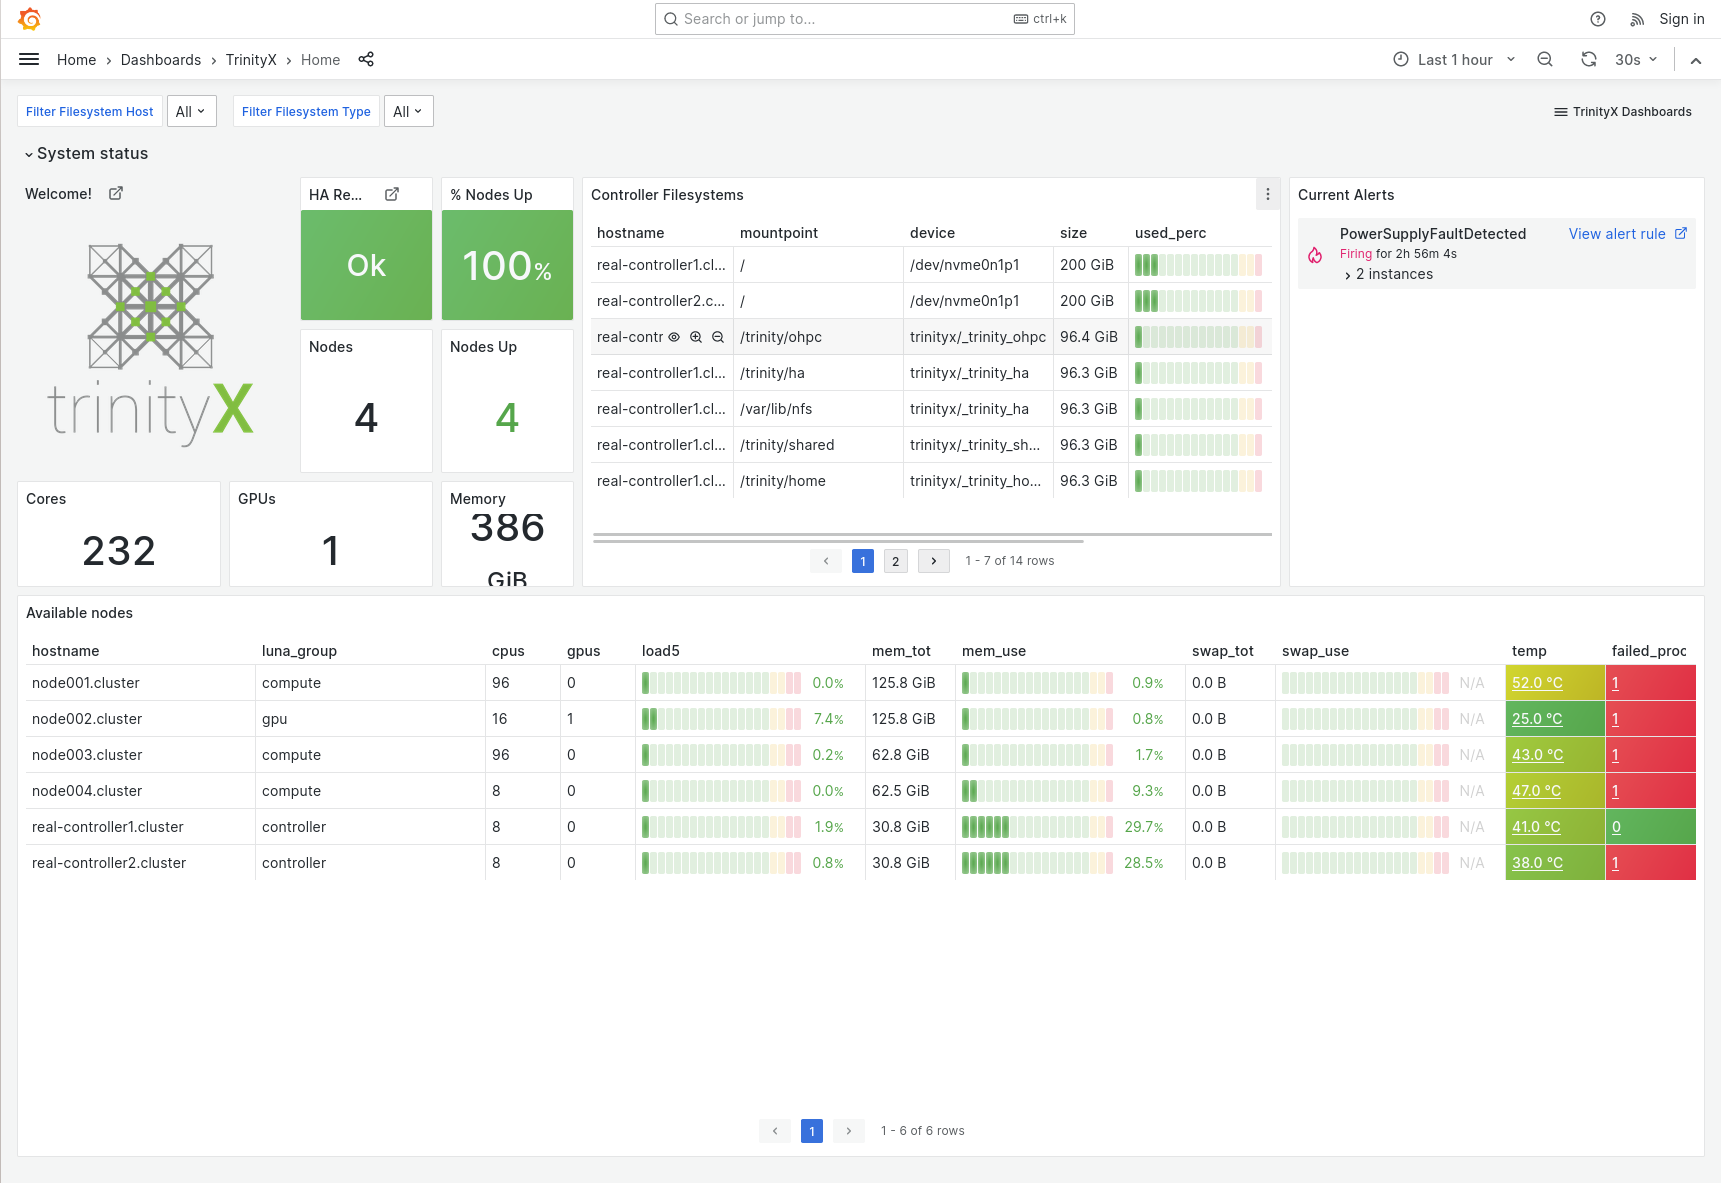
Home dashboard
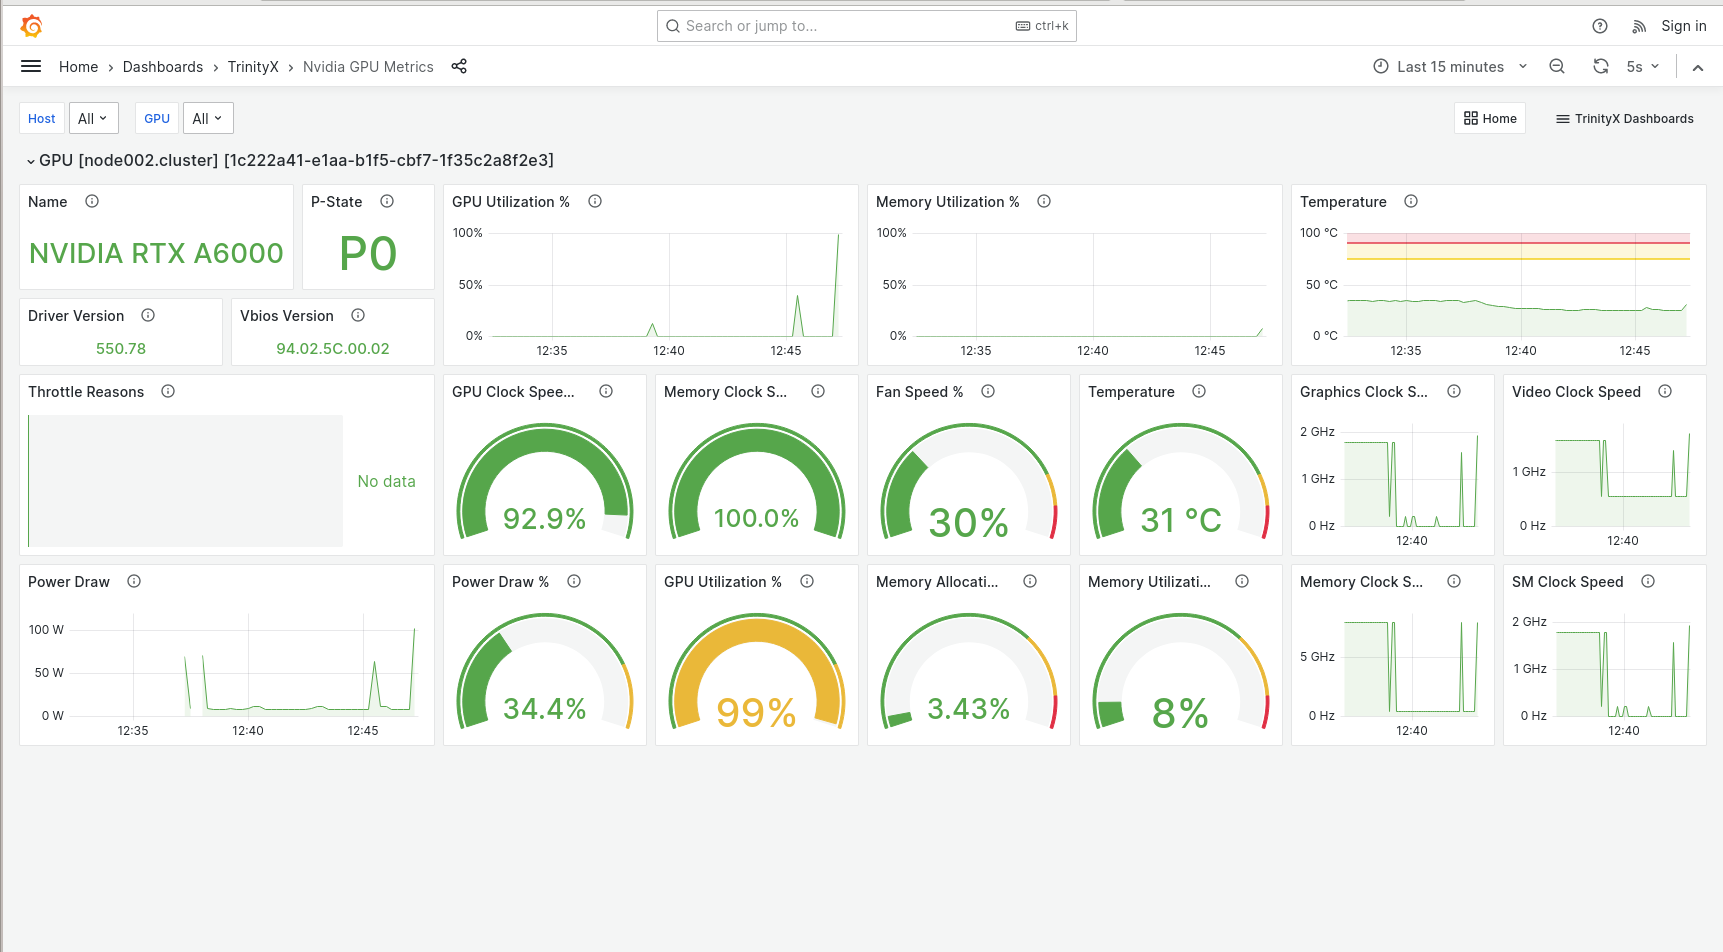
GPU dashboard
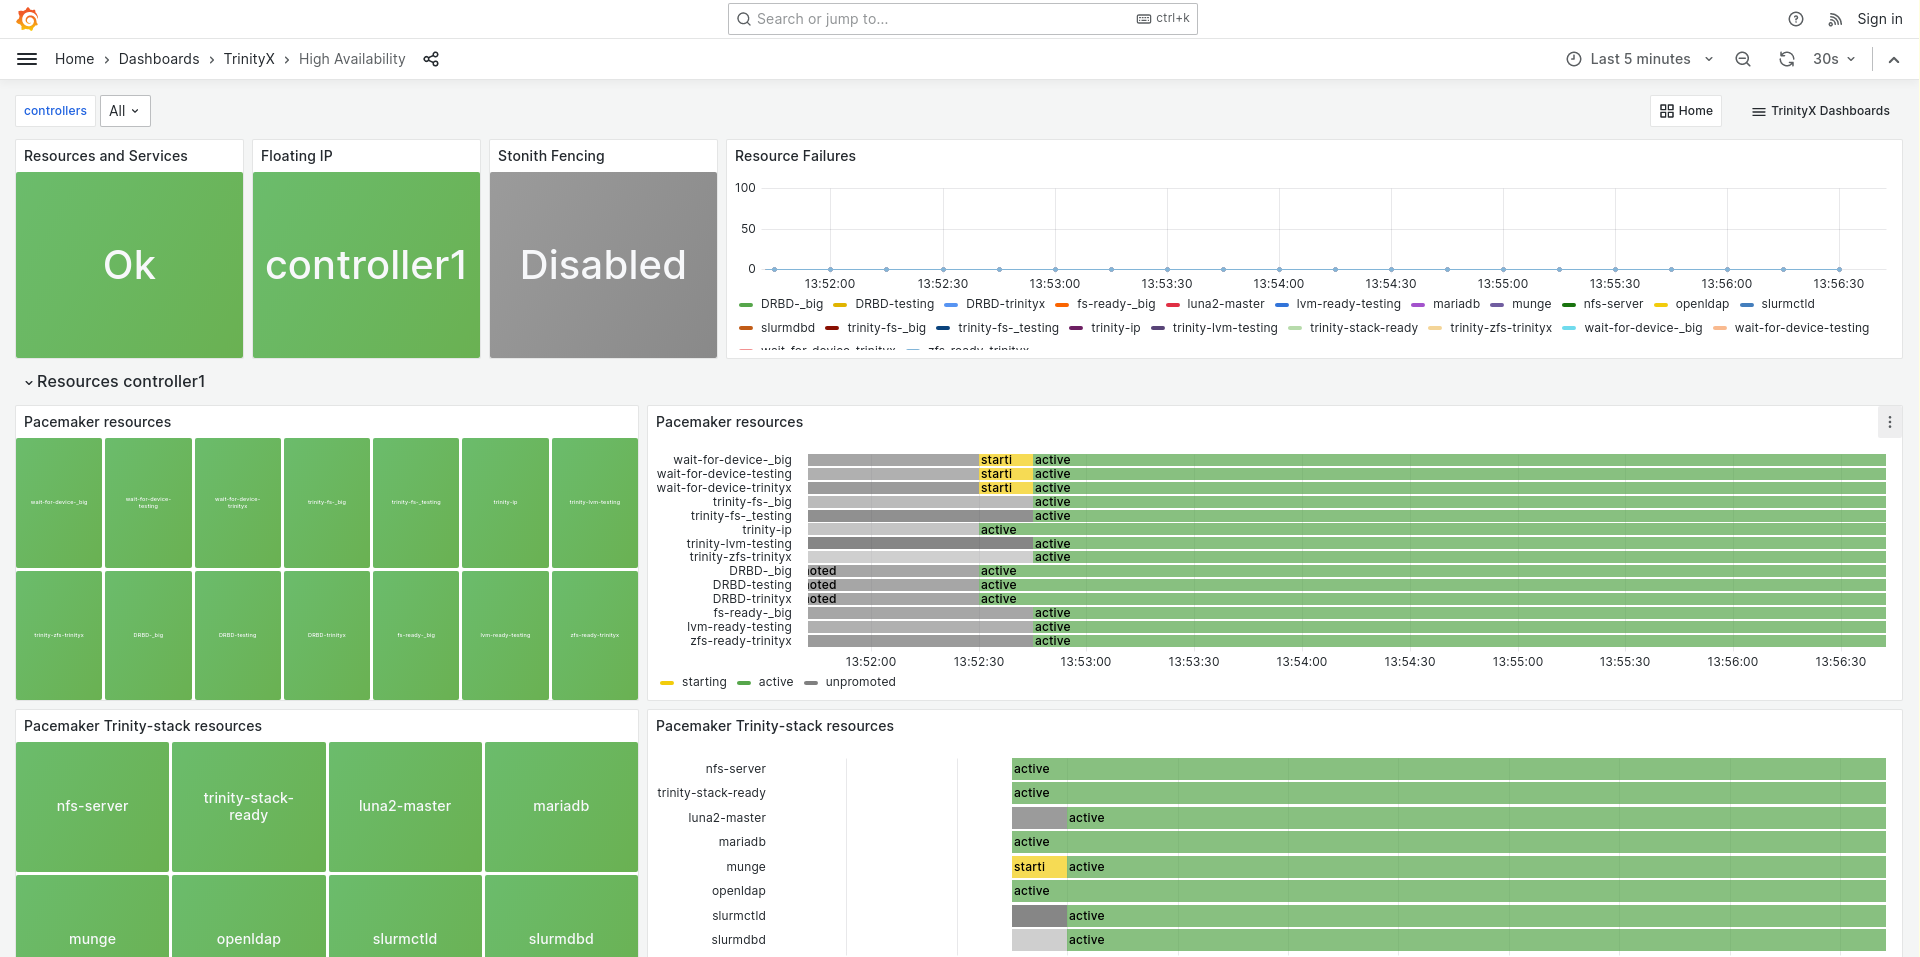
HA dashboard
ZFS filesystem dashboard
Alerting
See AlertX
Notes
- On sufficiently performant hardware, this setup can easily scale to a few thousands of nodes. For bigger sites it is recommended to disable the prometheus-server role and implement a custom hierarchical federation with multiple monitoring nodes.