Per-Job-Statistics or PJS
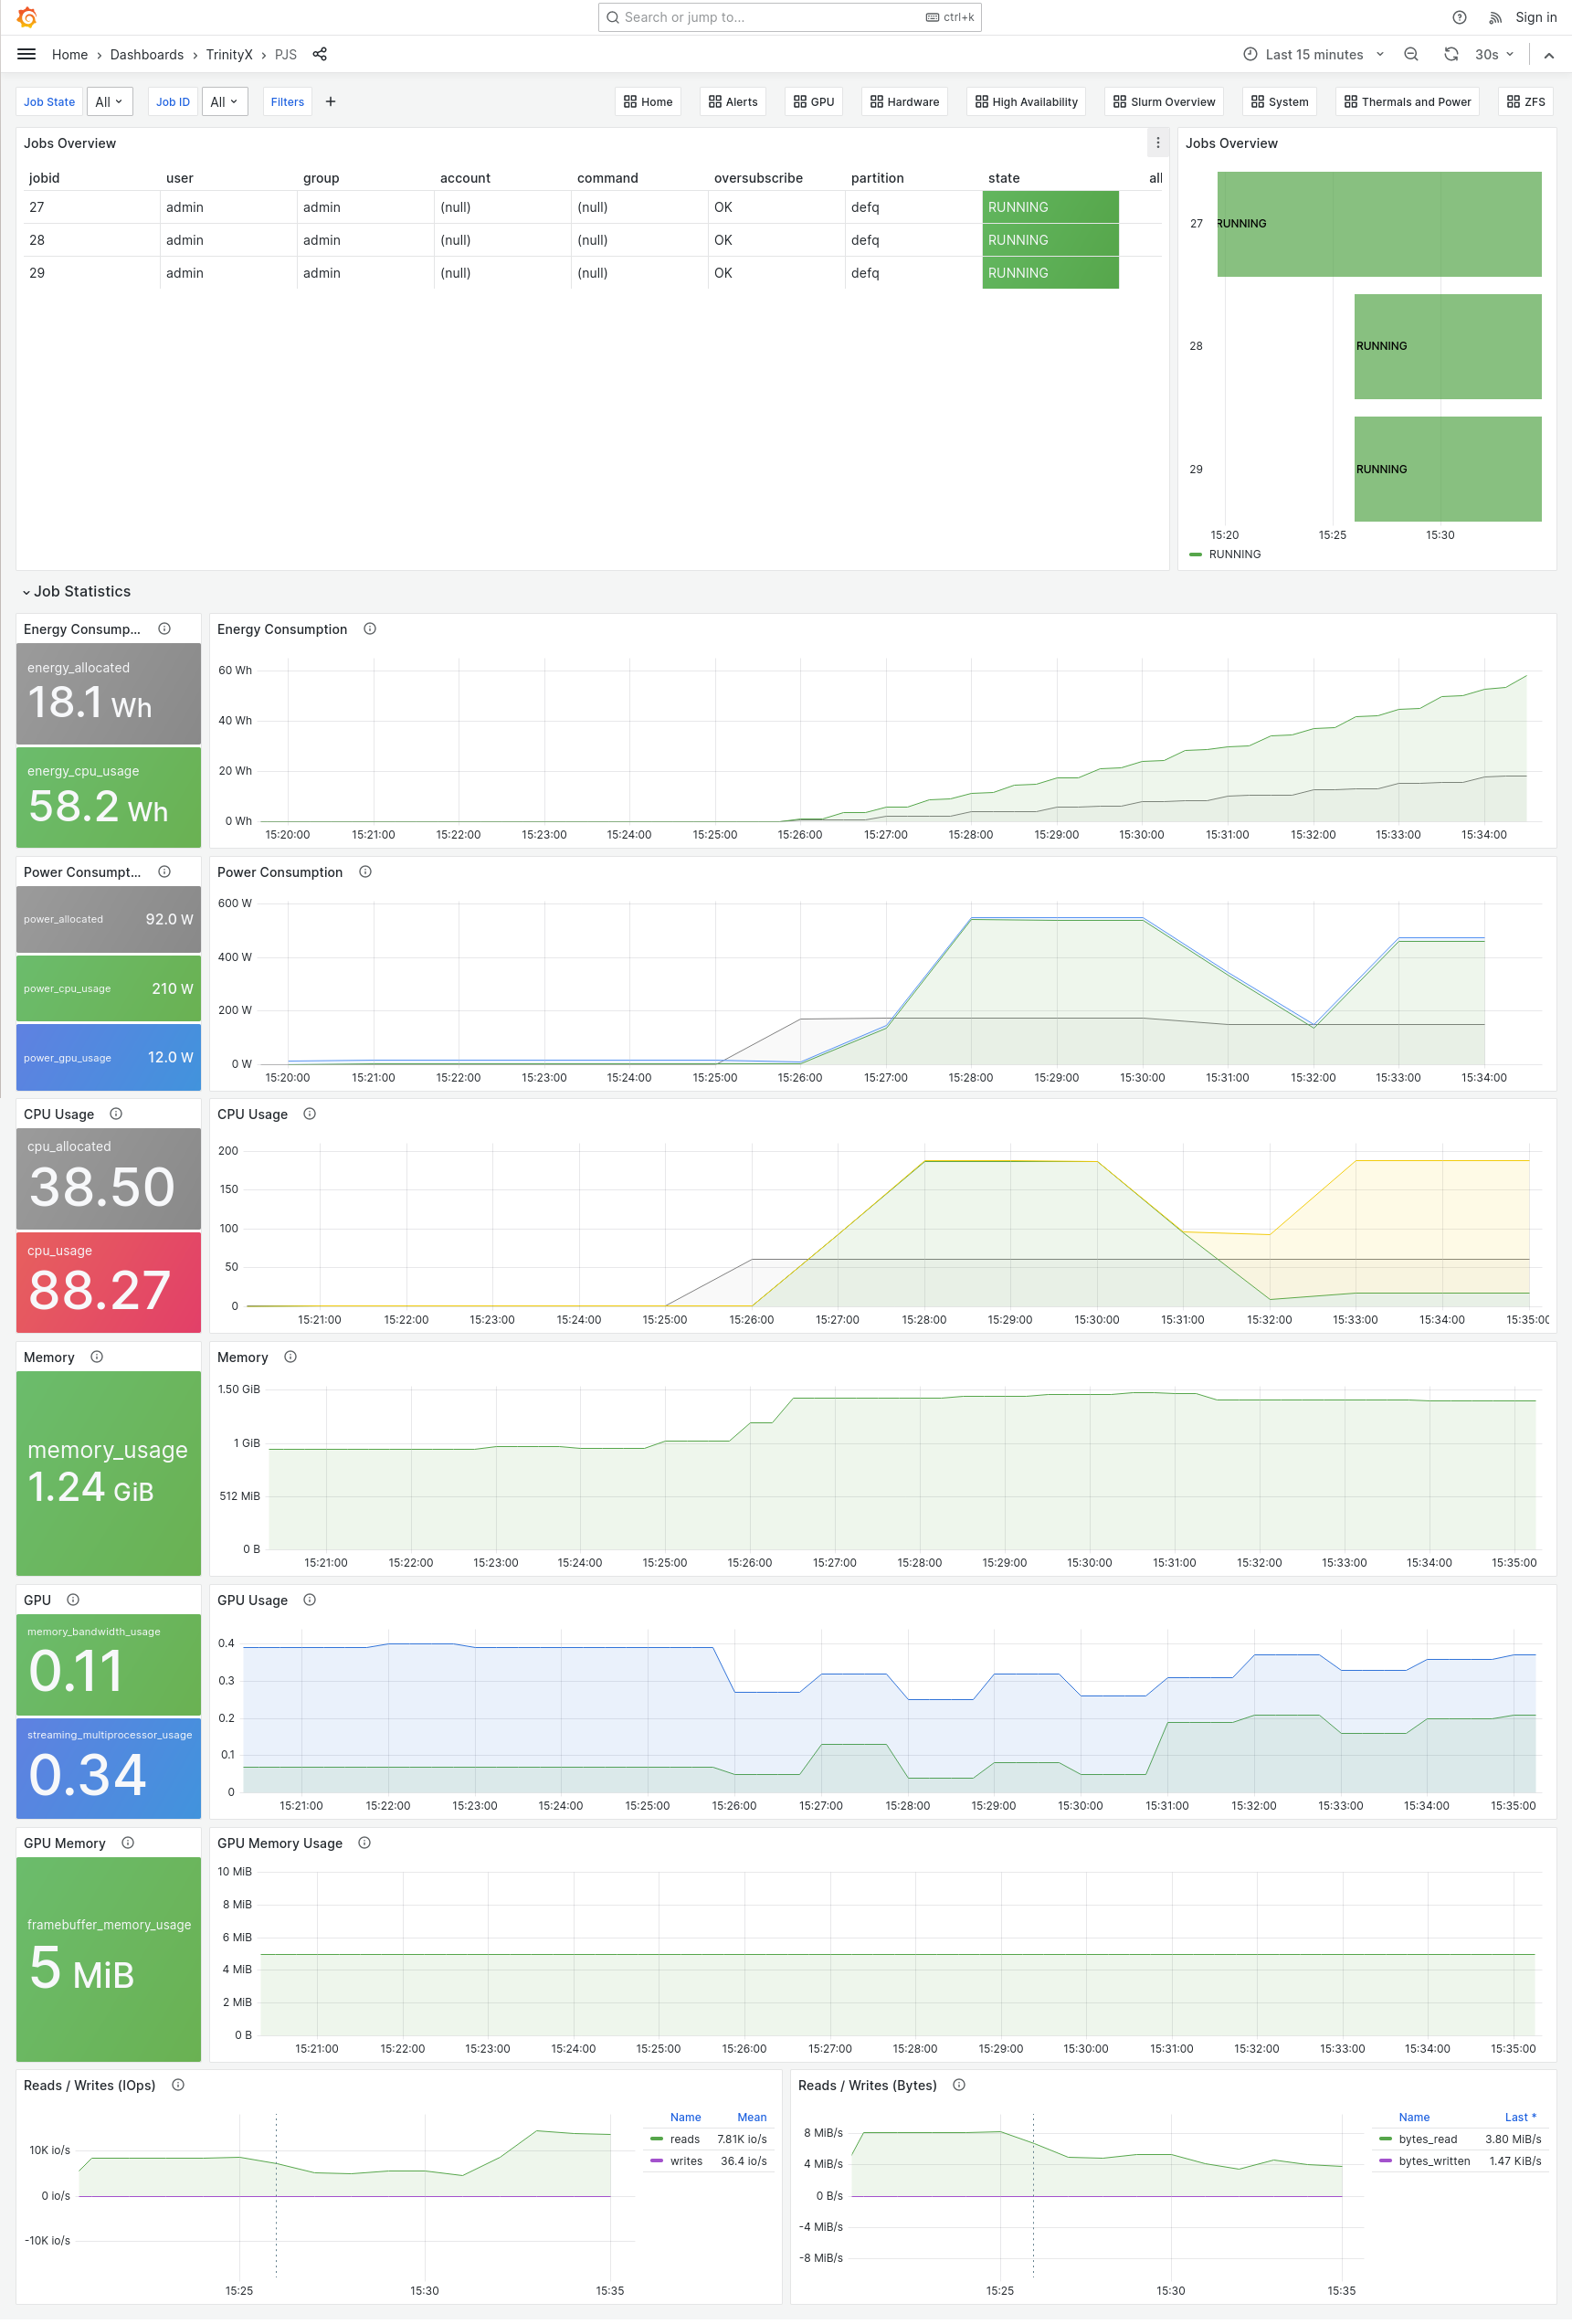
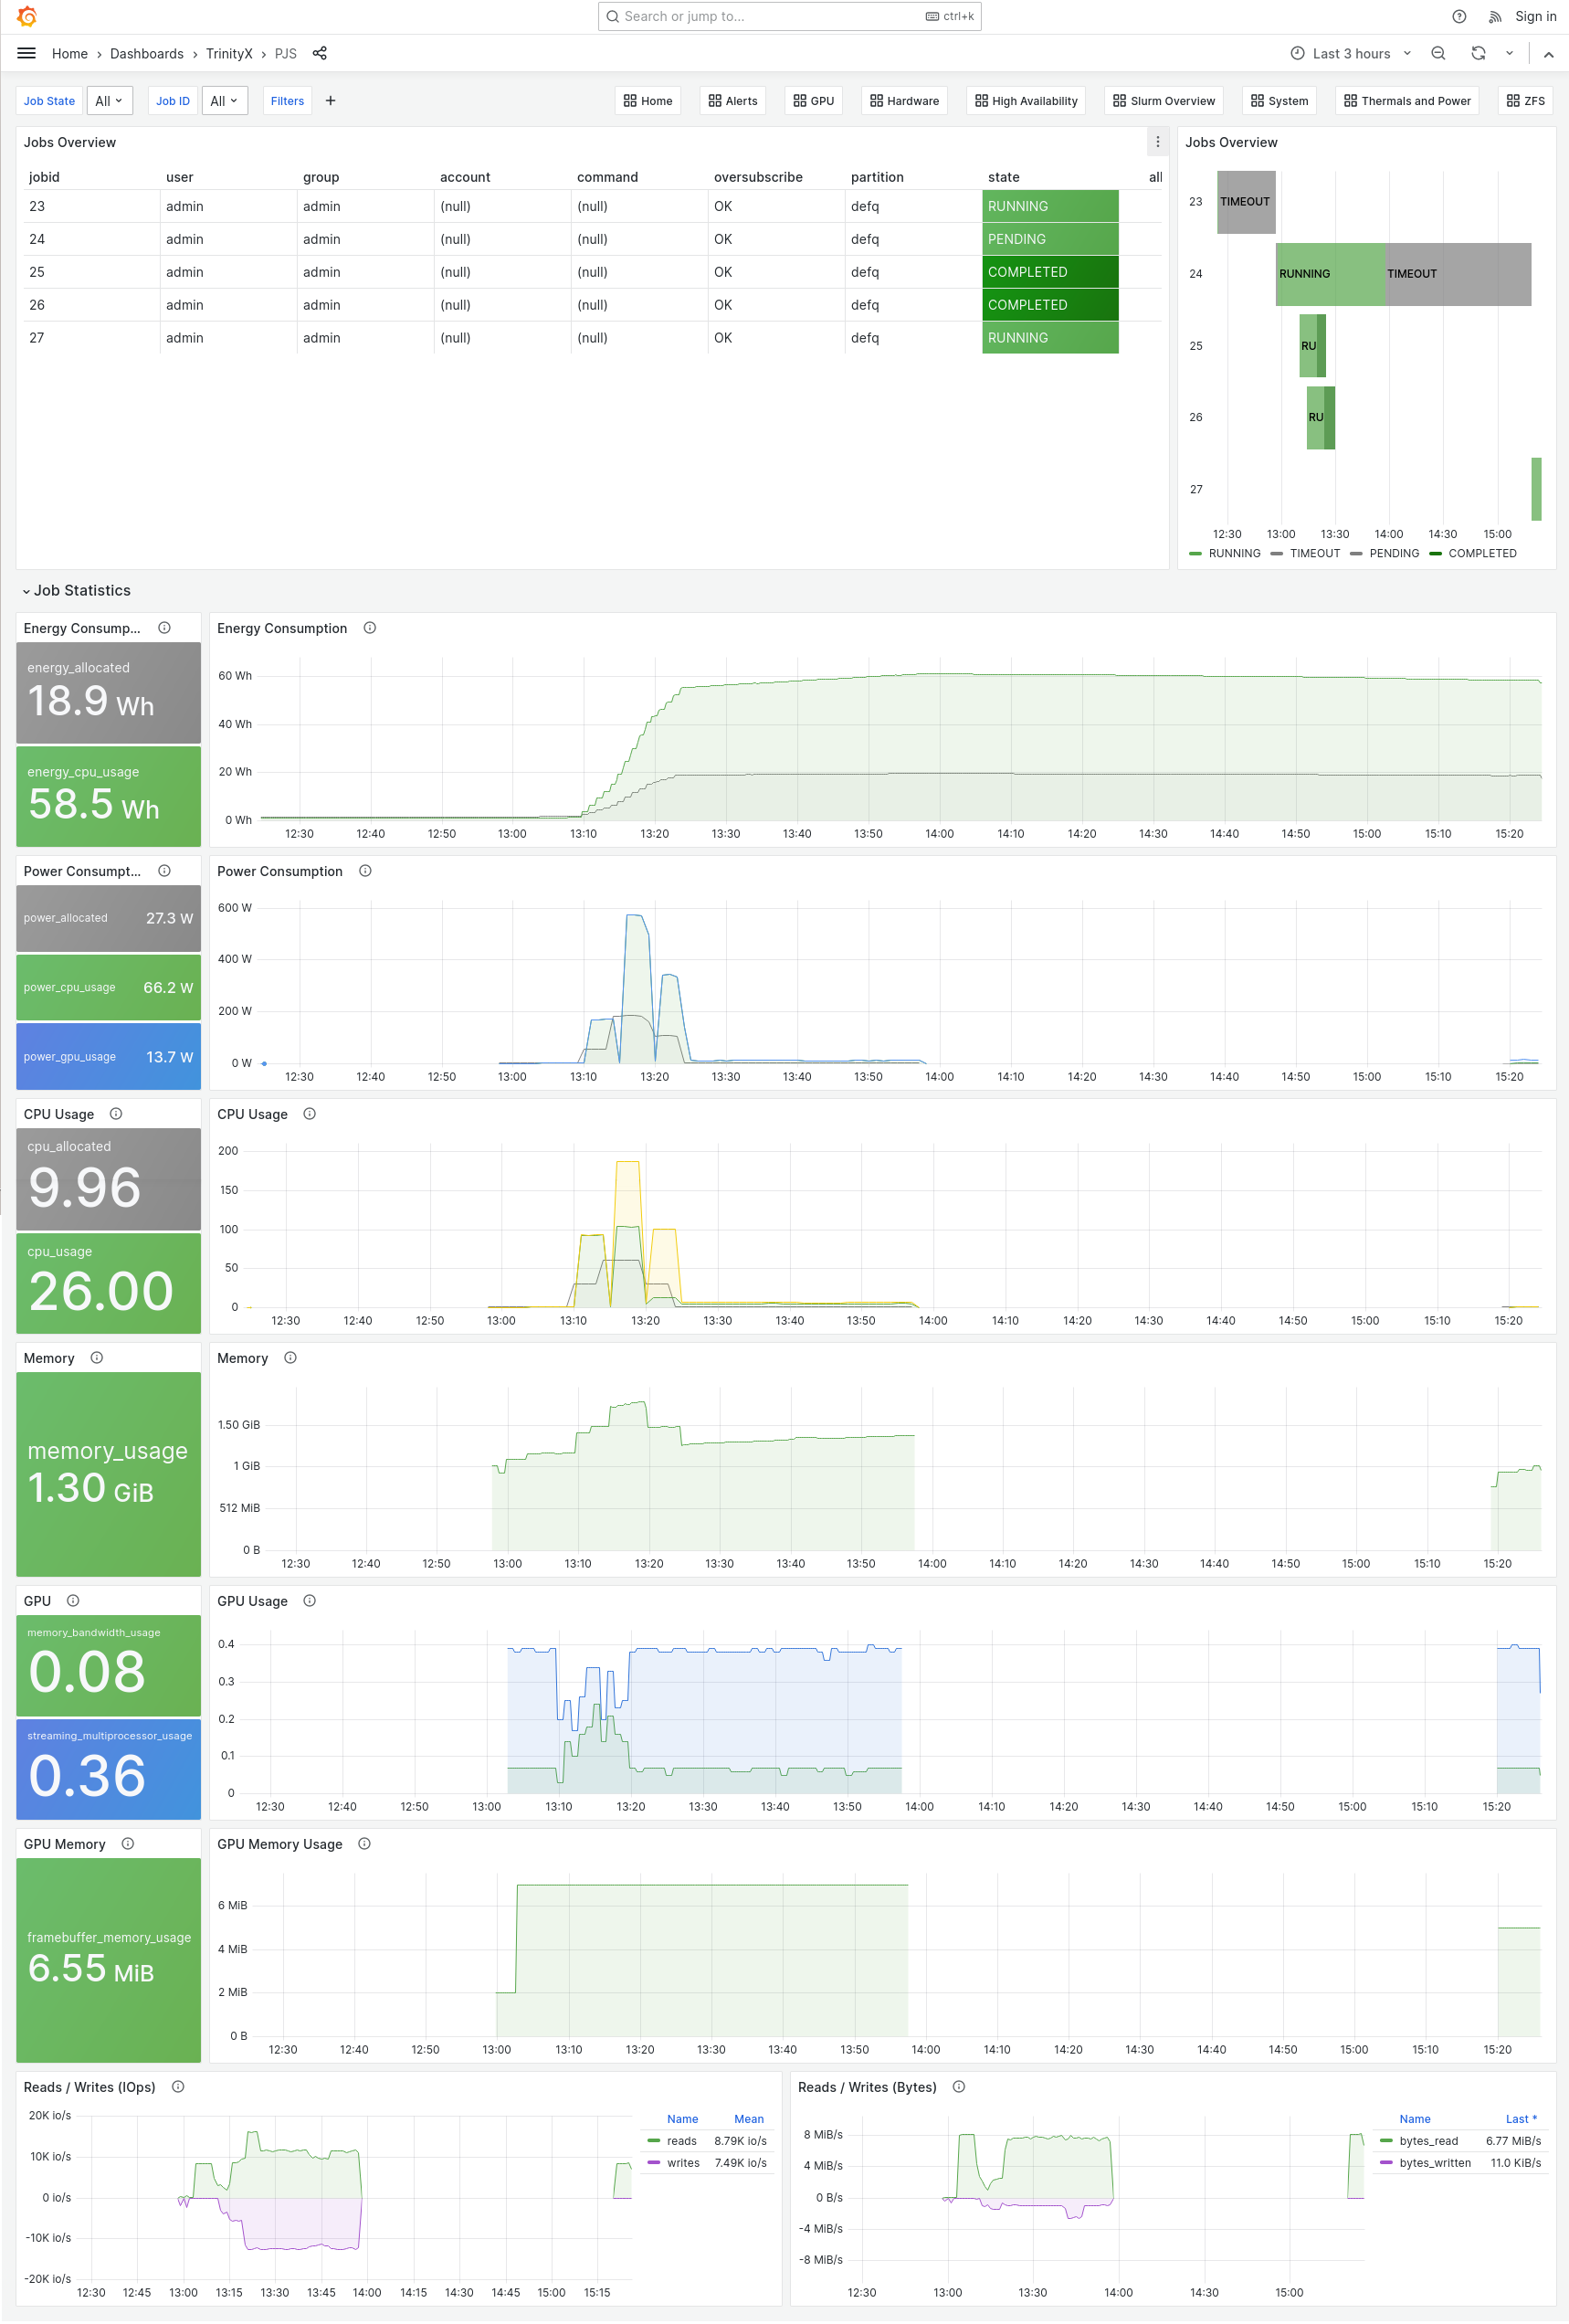
In general collected metrics are typically node or server oriented. This allows for generic resource monitoring, however it lacks the information to see how much a job actually consumed. The slurm pane in grafana shows how many resources were requested, but it also doesn't tell the complete story. Per-Job-Statistics is our attempt to deliver a job centric view on requested versus used resources. It supports exclusive node runs, multi node jobs and multiple jobs per node, shows details regarding CPU usage and efficiency as well as GPU utilization and Power draw figures. PJS can be accessed through the Grafana page.
Example of showing all, in this case 3 jobs at the time, 15min interval:

Example of showing all jobs the last few hours:

All current and recent jobs can be observed, but PJS also allows filtering for specific jobs or users. Currently only slurm is supported as the scheduler to provide the PJS functionality.
PJS was introduced with TrinityX 15