Operational Troubleshooting
Note
This page goes through common encountered problems during operation/use and how to deal with these.For installation time problems, please visit Installation troubleshooting
Basic diagnostics
TrinityX comes with a diagnosis tool which will check the required services.
# trinity_diagnosis
Trinity Core
        chronyd: active (running) since Tue 2023-10-17 20:45:29 CEST; 17h ago
        named: active (running) since Tue 2023-10-17 20:55:07 CEST; 17h ago
        dhcpd: active (running) since Tue 2023-10-17 20:49:52 CEST; 17h ago
        mariadb: active (running) since Tue 2023-10-17 20:46:20 CEST; 17h ago
        nfs-server: active (exited) since Tue 2023-10-17 20:44:38 CEST; 17h ago
        nginx: active (running) since Tue 2023-10-17 20:49:52 CEST; 17h ago


Luna
        luna2-daemon: active (running) since Tue 2023-10-17 20:49:51 CEST; 17h ago
        aria2c: active (running) since Wed 2023-10-18 13:50:51 CEST; 13min ago


LDAP
        slapd: active (running) since Tue 2023-10-17 20:45:31 CEST; 17h ago
        sssd: active (running) since Tue 2023-10-17 20:46:17 CEST; 17h ago


Slurm
        slurmctld: active (running) since Tue 2023-10-17 20:55:13 CEST; 17h ago


Monitoring core
        influxdb: active (running) since Tue 2023-10-17 20:54:32 CEST; 17h ago
        telegraf: active (running) since Tue 2023-10-17 20:55:17 CEST; 17h ago
        grafana-server: active (running) since Tue 2023-10-17 20:55:38 CEST; 17h ago
        sensu-server: active (running) since Tue 2023-10-17 20:55:31 CEST; 17h ago
        sensu-api: active (running) since Tue 2023-10-17 20:55:32 CEST; 17h ago
        rabbitmq-server: active (running) since Wed 2023-10-18 13:31:14 CEST; 33min ago


Trinity OOD
        httpd: active (running) since Tue 2023-10-17 20:55:16 CEST; 17h ago
Other troubleshooting utilities
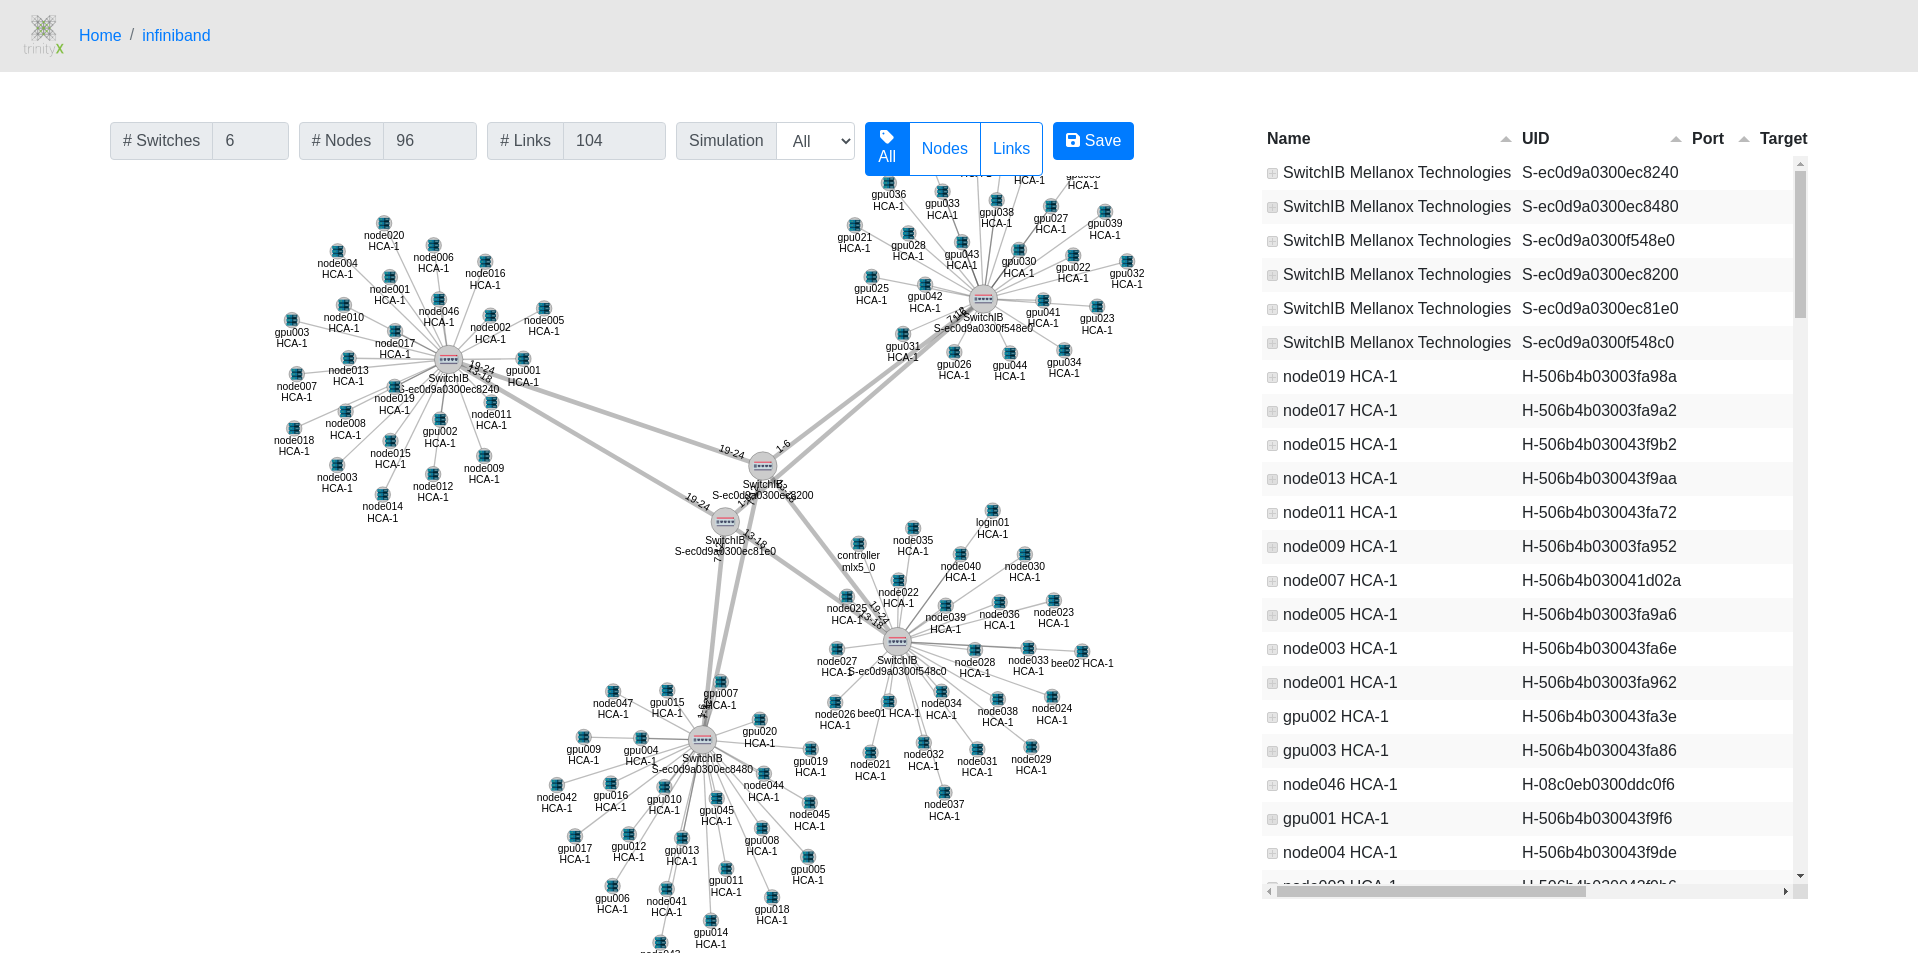
Bundled with TrinityX comes a graphical diagnostic application that helps troubleshooting Infiniband issues. It show the topology and highlights troubled links, including the host and port where the problems are seen.

Centralized syslog
Syslog is configured to collect all the logs from the services on the controller(s) and the nodes. Logs are commonly used to troubleshoot problems and are typically found in /var/log:
| component | location |
|---|---|
| services | /var/log/messages or their respective location |
| prometheus | /var/log/prometheus/* |
| luna daemon, utils and cli | /var/log/luna/* |
| nodes | /var/log/cluster-messages/* |
for the services configured by TrinityX, rotates are setup to prevent /var/log from filling up.
Problems encountered using TrinityX
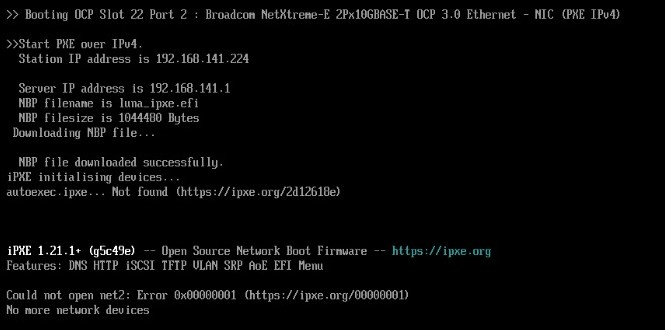
Nodes cannot boot
during the initial (i)PXE request, zero bytes are returned. Follow the following steps on the controller(s):
- Ensure there are at least two files in /var/lib/tftpboot with a size, i.e. not zero bytes:
- luna_ipxe.efi
- luna_undionly.kpxe
- Check the contents of /etc/dhcp/dhcpd.conf. there should be a block that looks like depicted below.
- Verify dhcpd and/or dhcpd6 is running. dhcpd6 is normally only needed to boot using IPv6
- Check the log /var/log/luna/luna2-daemon.log for any (suspicious) errors or warnings
- Verify whether the firewall is blocking traffic
- Try an alternative iPXE kernel
Example dhcpd.conf block:
subnet 10.141.0.0 netmask 255.255.0.0 {
    max-lease-time 28800;
    if exists user-class and option user-class = "iPXE" {
        filename "http://10.141.255.254:7050/boot";
    } else {
        if option client-architecture = 00:07 {
            filename "luna_ipxe.efi";
        } elsif option client-architecture = 00:0e {
        # OpenPower do not need binary to execute.
        # Petitboot will request for config
        } else {
            filename "luna_undionly.kpxe";
        }
    }
    next-server 10.141.255.254;
    range 10.141.10.0 10.141.255.253;
    option routers 10.141.255.254;
    option domain-name "cluster";
    ddns-domainname "cluster.";
    ddns-rev-domainname "in-addr.arpa.";
    update-static-leases on;
    option luna-id "lunaclient";
}
Firewall
If the controller and compute playbooks have completed, the dhcpd service is running but there is no boot possible, it could be that the firewall is not configured properly.
The default setup is that there is one public and one trusted interface in firewalld. If the group_vars/all.yml is not configured correctly, the interfaces are placed in public which is limited.
Misconfigured:
public (active)
  target: default
  icmp-block-inversion: no
  interfaces: ens192 ens224
  sources:
  services: cockpit dhcpv6-client ssh
  ports: 22/tcp 443/tcp 8080/tcp 3001/tcp 3000/tcp
  [...]
Correct:
public (active)
  target: default
  icmp-block-inversion: no
  interfaces: ens192
  sources:
  services: cockpit dhcpv6-client ssh
  ports: 22/tcp 443/tcp 8080/tcp 3001/tcp 3000/tcp
  [...]

trusted (active)
  target: ACCEPT
  icmp-block-inversion: no
  interfaces: ens224
The interface can be switched using firewall-cmd (where ens224 is the internal interface):
firewall-cmd --remove-interface ens224 --zone=public
firewall-cmd --add-interface ens224 --zone=trusted --permanent
firewall-cmd --reload
Alternative iPXE kernel
In some scenarios, the NIC firmware causes trouble. This will hinder iPXE booting by getting stuck at fetching the Luna boot splash screen or fetching the kernel.


This may be caused by the default iPXE kernel utilizing the compiled-in drivers, not working optimally with the NIC. In this case, an alternative iPXE kernel can be tried, which utilizes the NIC's built-in driver.
# mv /tftpboot/luna_ipxe.efi /tftpboot/luna_ipxe.efi.backup
# wget https://boot.ipxe.org/snponly.efi -O /tftpboot/luna_ipxe.efi
Then reboot the affected nodes.
Open OnDemand shows an internal server error 500
Upon accessing the URL for OOD, the below error is encountered.
Internal Server Error
The server encountered an internal error or misconfiguration and was unable to complete your request.

Please contact the server administrator at root@localhost to inform them of the time this error occurred, and the actions you performed just before this error.

More information about this error may be available in the server error log.
Two main reasons:
- The external FQDN (trix_external_fqdn) setting in the group_vars/all.yml config file, used during installation is not resolvable by the controller itself. Make sure the controller can resolve its own FQDN by pointing the forwarder to your own DNS server (that can resolve the external FQDN) or add an entry in /etc/hosts to match. Please refer to Open OnDemand section.
- The certificate generated for the controller contains the FQDN as a valid host. The FQDN (trix_external_fqdn) is typically set in the group_vars/all.yml config file during installation time. When this name does not match with how the external IP of the controller is resolved, the certificate is not valid. Please refer to Generating alternative certificates for OpenOndemand, OOD for a howto to generate an alternative certificate.
Luna Graphical applications show Internal Server Error
Due to changes on the luna daemon side, the graphical luna applications might render an Internal Server Error. This is most likely caused by updating luna, but not included the ood-apps. To solve this issue, update the ood-apps:
ansible-playbook controller.yml --tags=ood-apps,luna
Please also look at Updating using the cloned TrinityX branch.
Slurm Graphical Configurator application shows 'list index out of range' message
Starting the Slurm Graphical Configurator results in a white screen with the text
{"message":"list index out of range"}.
To solve this issue, update the config-manager and restart Open OnDemand services:
ansible-playbook controller.yml --tags=config-manager
systemctl restart htcacheclean httpd
After logging into the portal again, the application works as intended.
Please also look at Updating using the cloned TrinityX branch
Error 500 on graphical nodes and groups applications after updating luna
For TrinityX 15.1 some new parameters (_meta) were added that were not backwards compatible, causing trouble for the graphical luna applications after updating luna. Please update the ood-apps as well to be inline again with these new parameters.
ansible-playbook controller.yml --tags=luna,ood-apps
systemctl restart htcacheclean httpd
OpenLDAP update breaks backend
TrinityX stores the ldap configuration and the database backend in different locations to aid in easy backup strategies. By default the configuration is in /trinity/local/etc/openldap/slapd.d, while the database is in /trinity/local/var/lib/ldap. During RPM updates for openldap, the symlink in /etc/openldap/slapd.d may be overwritten, causing problems.
The following steps restore openldap functionality:
- systemctl stop openldap
- mv /etc/openldap/slapd.d to e.g. /etc/openldap/slapd.d-org if this is not the correct symlink
- ln -s /trinity/local/etc/openldap/slapd.d /etc/openldap/slapd.d
- systemctl start openldap
Note: For HA installations, the paths are typically in /trinity/ha/etc/openldap/slapd.d and /trinity/ha/var/lib/ldap
AlertX has drained my nodes
AlertX drainer monitors the triggered alerts in prometheus and alert manager. When a node is affected by a NHC triggered rule, the node is drained to not participate in new scheduled jobs. This is intended and prevents possible bigger disasters where a faulty node could soup up and fail all jobs in the jobs queue. The best approach is to see what triggered the drain. Please have a look at the AlertX section for further troubleshooting.