Monitoring
TrinityX monitoring is based on the well known Prometheus and Grafana stack. Prometheus architecture is pull-based, meaning that each system and service to be monitored will expose an HTTP endpoint, that will be periodally scraped by the Prometheus Server
From an architectural perspective we can identify 4 major pillars:
- Metrics exporting
- Metrics collection & storing
- Dashboards & Graphing
- Alerting

Metrics exporting
TrinityX bundles 5 different prometheus exporters, some of them will run on controller nodes, other on compute nodes and some on both
| Name | Controller | Node | Port |
|---|---|---|---|
| node-exporter | ✅ | ✅ | 14200 |
| ipmi-exporter | ✅ | ✅ | 14202 |
| nvidia-exporter | ❌ | ✅ | 14203 |
| slurm-exporter | ✅ | ❌ | 14204 |
| ha-exporter | ✅ | ❌ | 14205 |
| infiniband-exporter | ✅ | ✅ | 14206 |
| slurm-job-exporter | ❌ | ✅ | 14207 |
Infiniband-exporter
TrinityX 15.3+ will only run the Infiniband exporter on the controllers and login nodes.Metrics collection & storing
Metrics collection is performed by a standard prometheus server, on a standard installation it is running on all the controllers at port 9000 and the configuration file can be found at trinity/local/etc/prometheus_server/prometheus.yml.
Intervals and timeouts
global:
  scrape_interval: 15s
  scrape_timeout: 10s
  evaluation_interval: 15s
Rule files
rule_files:
  - /trinity/local/etc/prometheus_server/rules/*.rules
Scraping targets, there are 3 locations from where targets are loaded, either with HTTP discovery and File-based discovery
scrape_configs:
  # TrinityX reserved - Luna daemon exposing dynamic list of node exporters
  - job_name: luna_controllers
    file_sd_configs:
    - files:
      - /trinity/local/etc/prometheus_server/file_sd/trix/*.yml
  # TrinityX reserved - File based controller exporters
  - job_name: luna_nodes
    http_sd_configs:
    - url: https://localhost:7050/export/prometheus
  # General Purpose - Additional exporters
  - job_name: other_nodes
    file_sd_configs:
    - files:
      - /trinity/local/etc/prometheus_server/file_sd/other/*.yml
And alerting
alerting:
  alertmanagers:
    - static_configs:
        - targets:
          - localhost:9093
      scheme: https
      basic_auth:
        username: admin
        password: XXXXXXXXXXXXXX
Adding cluster unmanaged servers for monitoring
What file_sd is used for
Besides scraping the cluster nodes (discovered dynamically from the Luna daemon over HTTP service discovery), Prometheus also loads targets through file-based service discovery (file_sd). With file_sd, Prometheus watches a set of YAML/JSON files on disk and reloads the target list automatically whenever those files change — no Prometheus restart or reload is required.
TrinityX uses two file_sd directories, both under /trinity/local/etc/prometheus_server/file_sd/:
| Directory | Scrape job | Purpose |
|---|---|---|
file_sd/trix/ |
luna_controllers |
TrinityX-reserved. Files here are generated and overwritten by the Ansible exporter roles for the controllers (node, ipmi, slurm, nvidia, ha, infiniband, …). Do not edit them by hand. |
file_sd/other/ |
other_nodes |
General purpose. Empty by default. This is the place to add your own scrape targets, including cluster-unmanaged and cluster-external devices. |
trix/ is managed
Any file you place infile_sd/trix/ will be overwritten the next time the playbook runs. Always use file_sd/other/ for manually added targets.
Adding an unmanaged or external target
Cluster-unmanaged servers (nodes not provisioned by Luna) and cluster-external devices (storage appliances, switches, login/bastion hosts, anything reachable over the network that exposes a Prometheus-compatible metrics endpoint) can be scraped by dropping a target file into file_sd/other/.
- Make sure the target exposes a Prometheus metrics endpoint — for a generic Linux server this is typically
node-exporter. - Create a YAML file in the
otherdirectory, e.g./trinity/local/etc/prometheus_server/file_sd/other/external.yml:
- targets:
    - 10.141.255.10:9100
  labels:
    hostname: storage01.cluster.local
    role: storage
- targets:
    - 10.141.255.11:9100
    - 10.141.255.12:9100
  labels:
    role: edge
Each entry is a target group: a list of host:port endpoints sharing the same labels. The labels are attached to every metric scraped from those targets and are what you filter and group on in Grafana, so set at least a meaningful identifying label such as hostname.
- That's it. Prometheus detects the new file within one scrape interval and starts scraping; no service restart is needed. Confirm the new targets appear and are
UPunder Status → Targets in the Prometheus web UI (port 9090), under theother_nodesjob.
Non-default endpoints
Targets are scraped on the metrics path/metrics over HTTP by default. To override per target group, set the meta-labels __scheme__ (e.g. https) and/or __metrics_path__ in the labels block.
Dashboards & Graphing
TrinityX come default with a rich set of graphical applications and grafana dashboards allowing to view the status of various components like rack view with metric overlay, cluster (home), slurm, zfs, HA and others.
Rackview is useful to locate temperature and power hot spots:
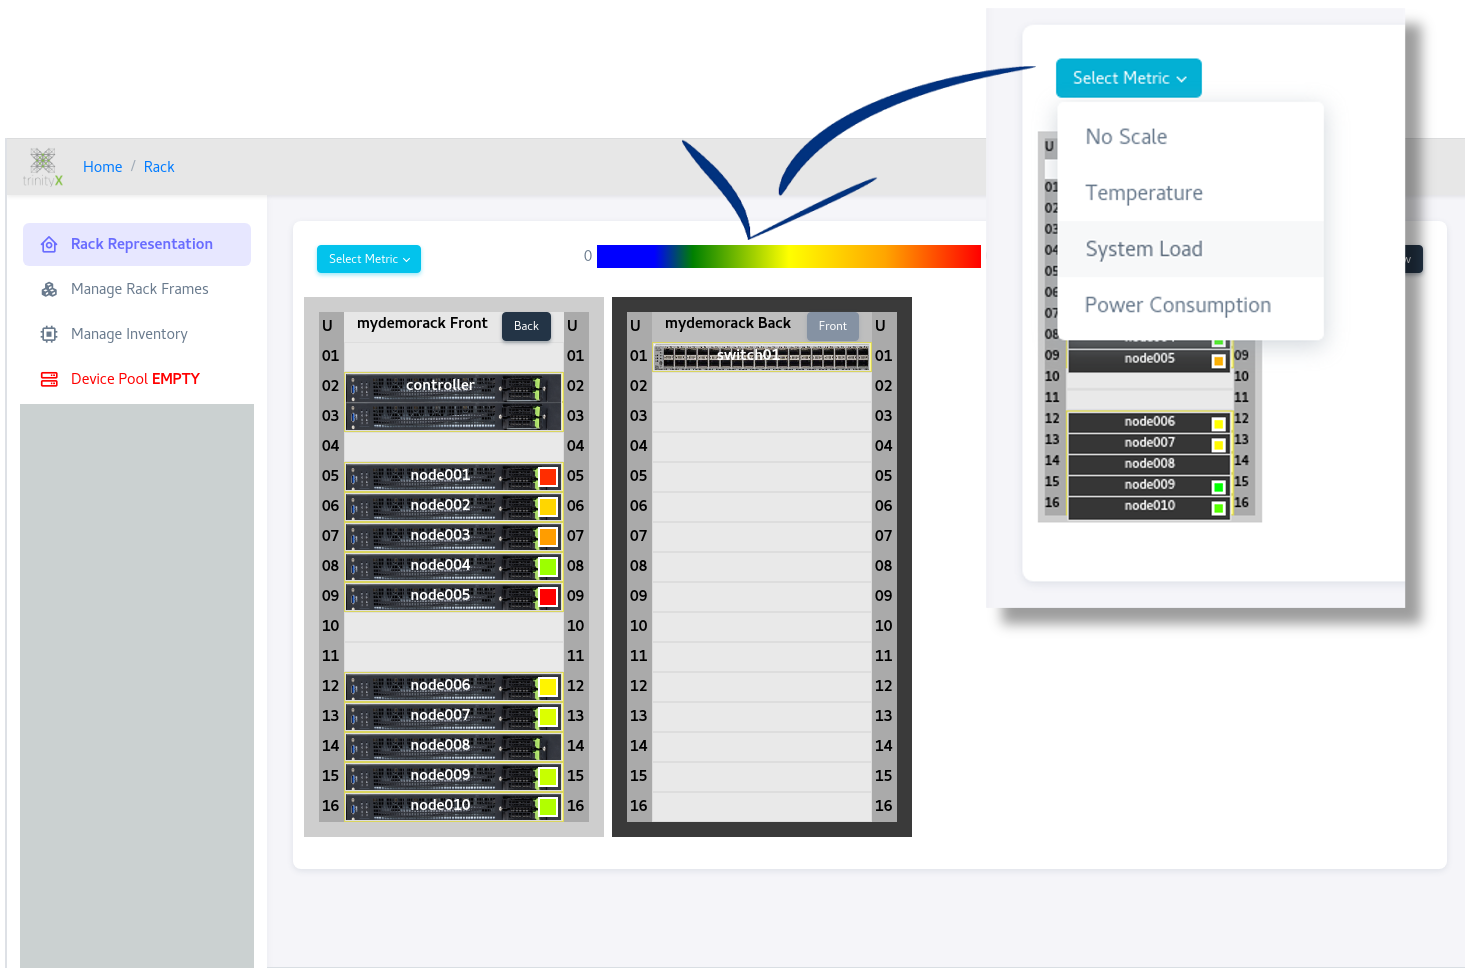
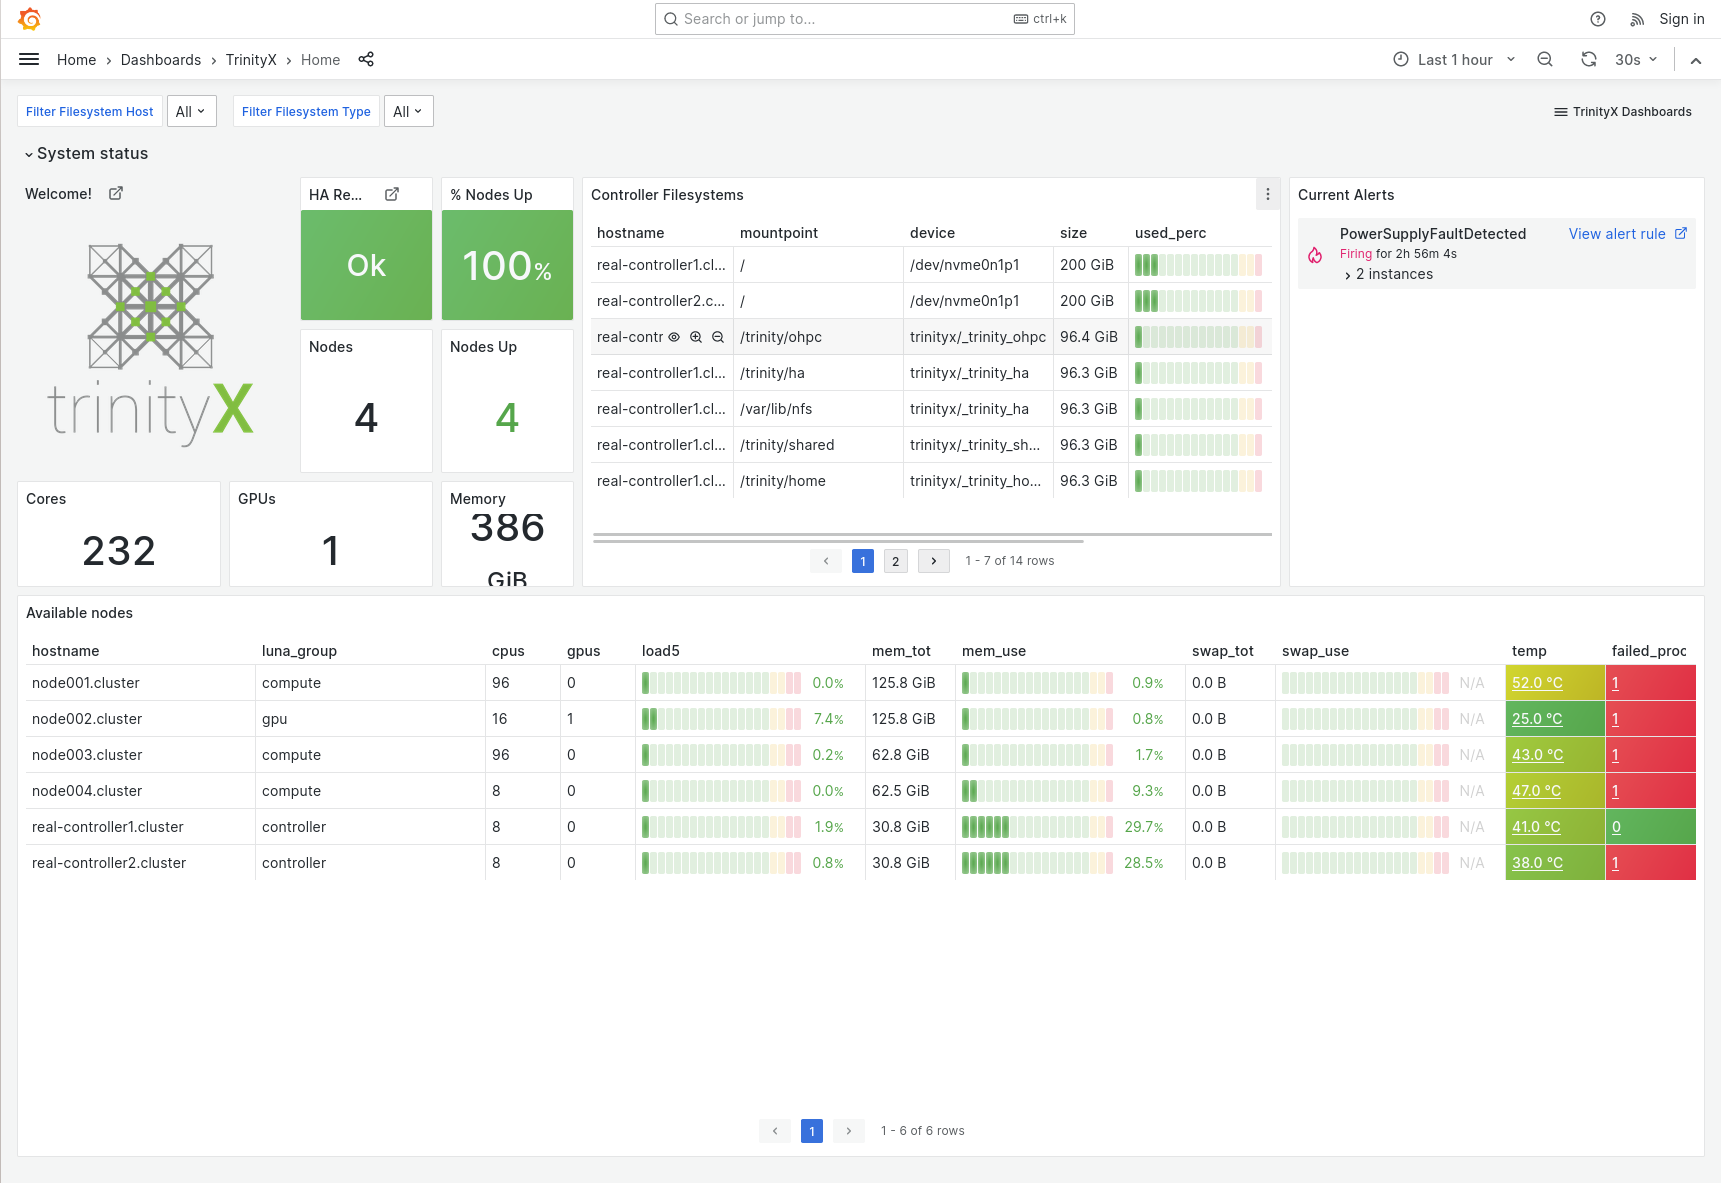
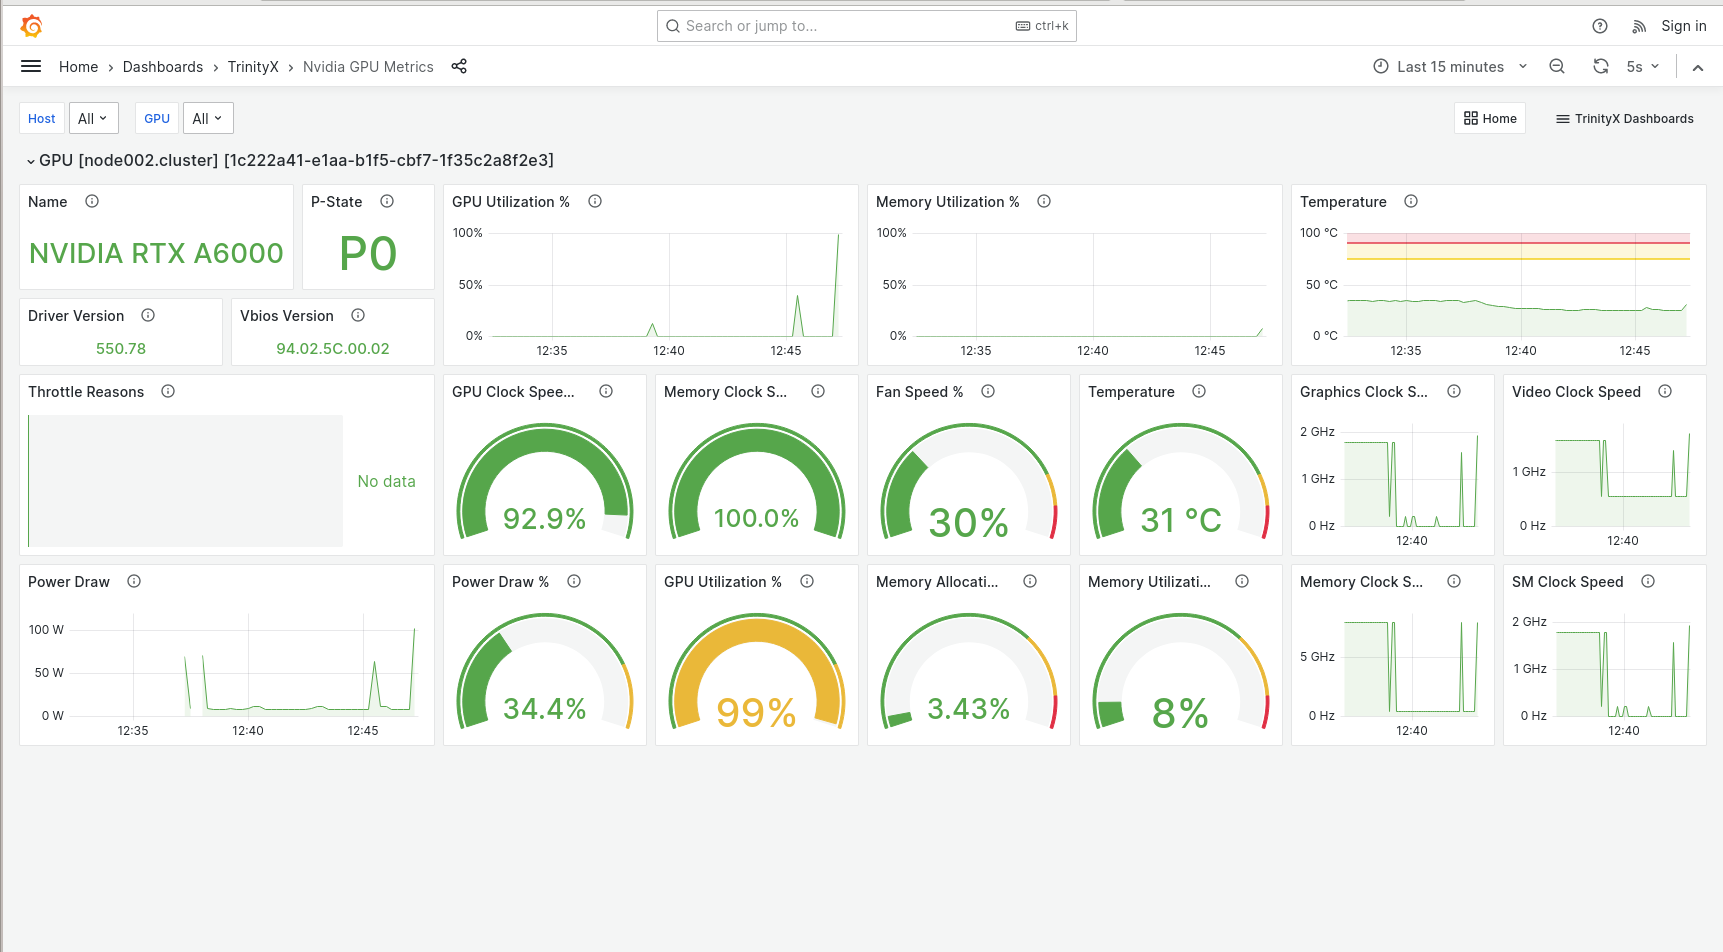
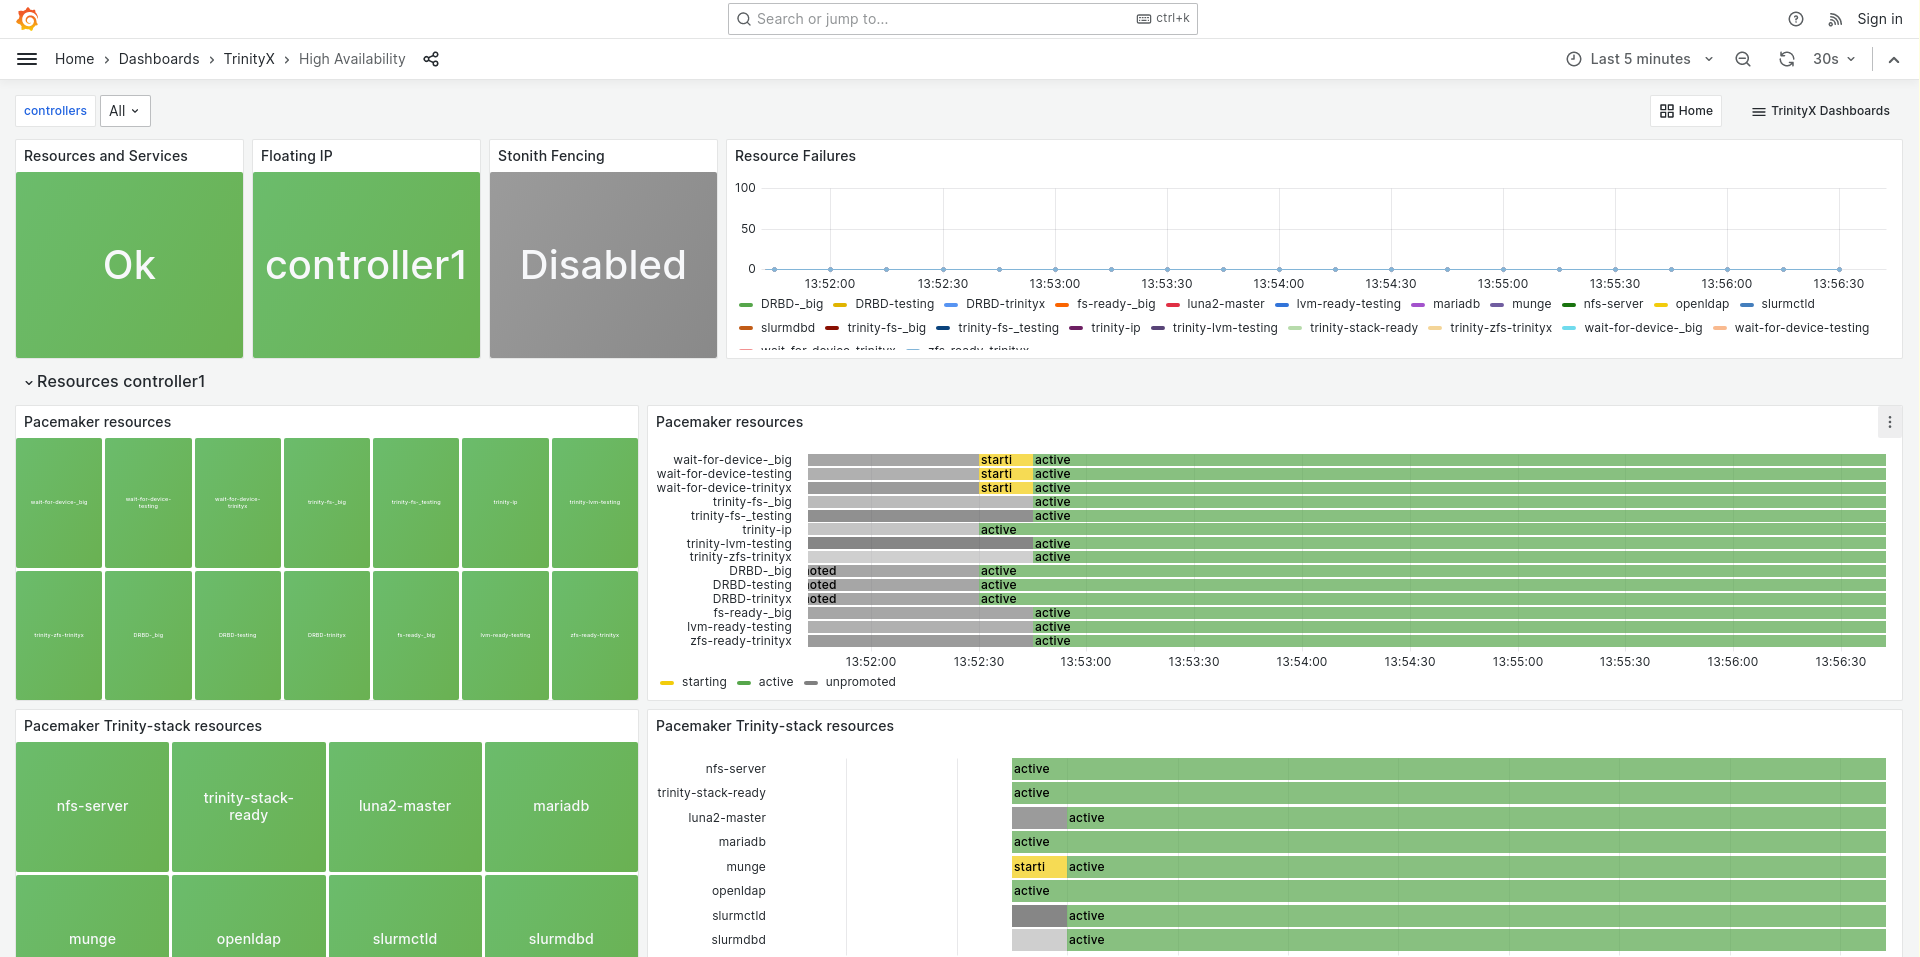
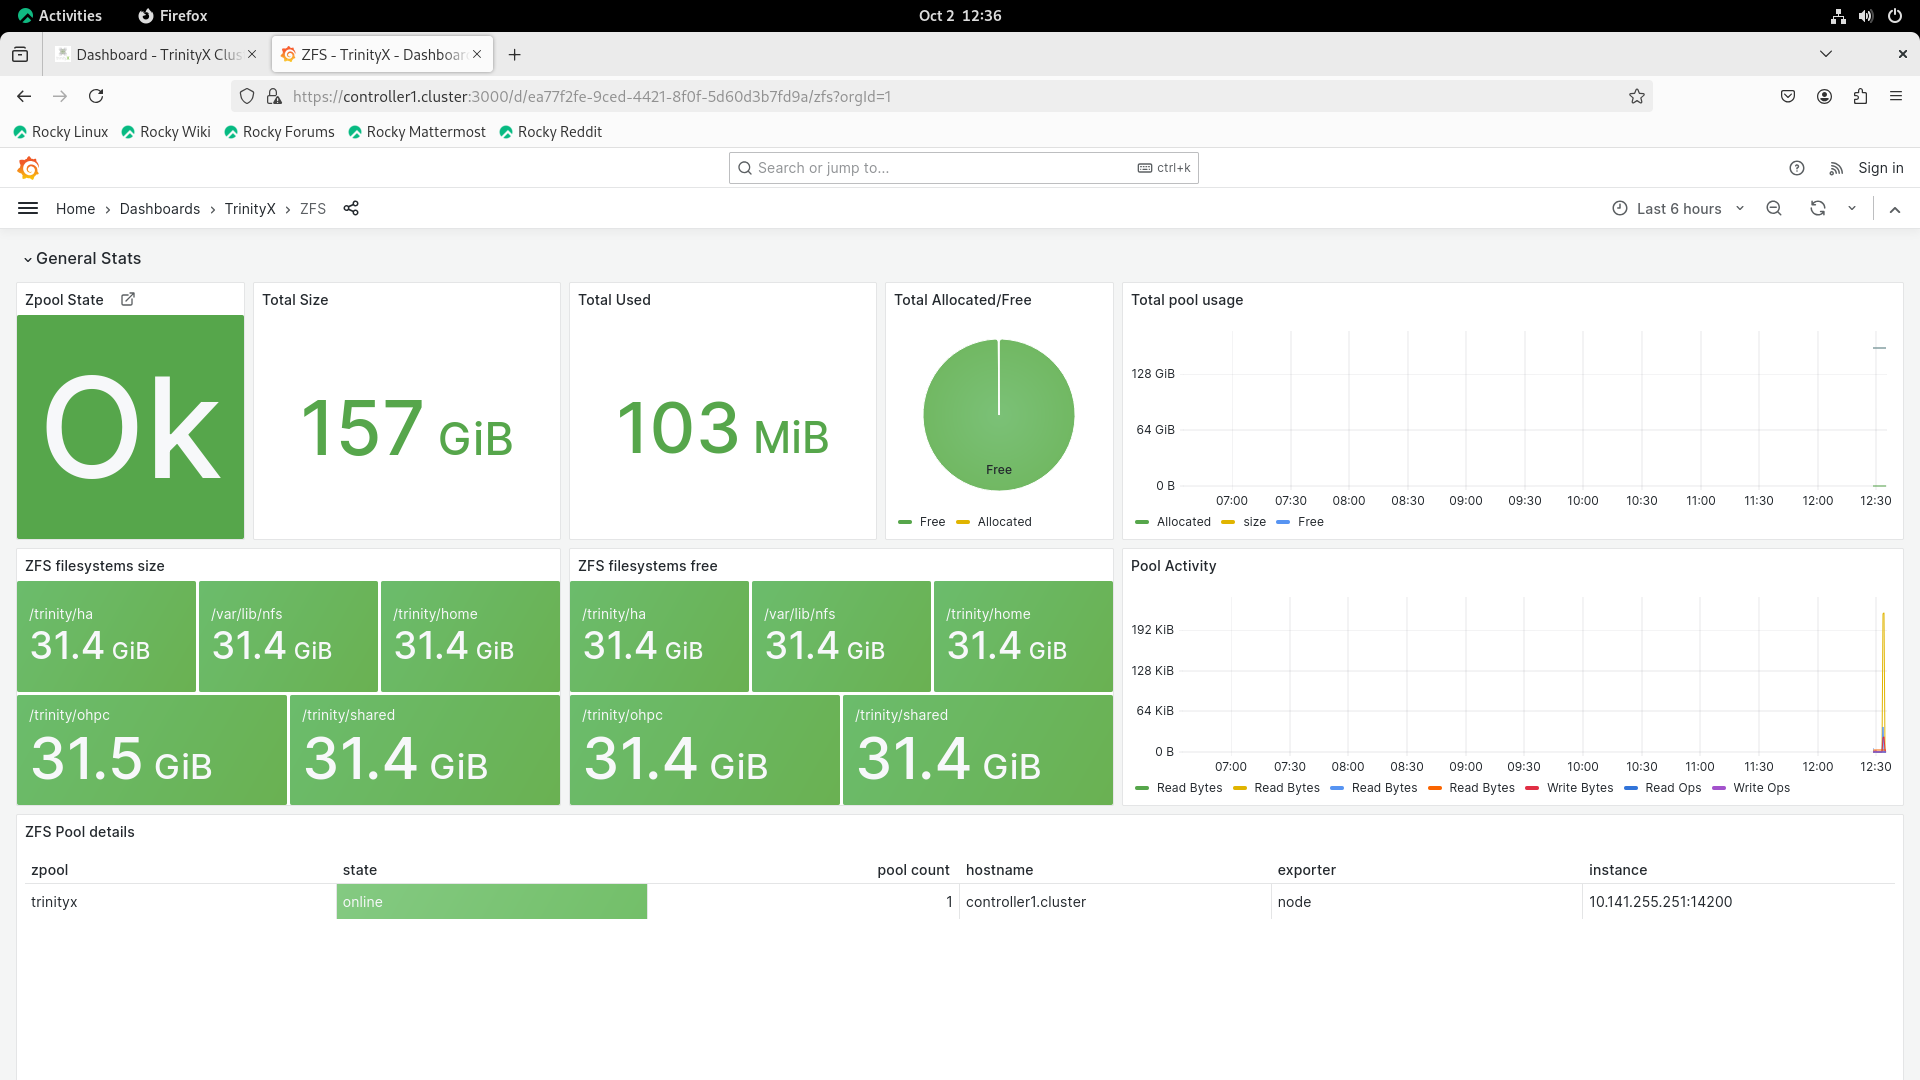
Some example grafana screenshots:
Home dashboard
GPU dashboard
HA dashboard
ZFS filesystem dashboard
Alerting
See AlertX
Notes
- On sufficiently performant hardware, this setup can easily scale to a few thousands of nodes. For bigger sites it is recommended to disable the prometheus-server role and implement a custom hierarchical federation with multiple monitoring nodes.